 Buy Crypto
- Markets
 Futures
- Spot
- Copy Trade
- Earn
- More
If Ethereum drops below $4200, the cumulative long liquidation strength of major CEXs will reach $1.53 billion.
BlockBeats News, September 3rd, the cryptocurrency market continues its downward trend. According to Coinglass data, if Ethereum falls below $4200, the cumulative long liquidation intensity of mainstream CEXs will reach $1.553 billion.
Conversely, if Ethereum breaks above $4400, the cumulative short liquidation intensity of mainstream CEXs will reach $0.940 billion.
BlockBeats Note: The liquidation chart does not accurately display the number of contracts awaiting liquidation or the exact value of contracts being liquidated. The bars on the liquidation chart actually represent the importance of each liquidation cluster relative to neighboring clusters, i.e., intensity. Therefore, the liquidation chart shows the extent to which the price of the underlying asset will be affected when it reaches a certain level. Higher "liquidation bars" indicate that the price, when reached, will experience a more pronounced reaction due to a liquidity cascade.
You may also like

How the US-Iran War Could Affect Oil and Bitcoin Prices (Latest Analysis)
The outbreak of the US-Iran war on February 28, 2026, has provided an unprecedented real-time laboratory for understanding how geopolitical oil shocks interact with an increasingly institutionalized cryptocurrency market. This article examines the relationship between crude oil prices and Bitcoin throughout the conflict, analyzing price movements, correlation patterns, and the underlying transmission mechanisms.

OpenAI Wants to Write Its Own Rules|Rewire News Brief

Chaos Labs Exits, Who Will Pick Up Aave's Risk?
Stealthy Financial War? Iran Collects Strait Transit Fees in Stablecoin

OpenAlice: One Person, That's a Jane Street | Project Overview

The Small-Town Youth Labeling Big AI Models

Morning Report | Strategy increased its holdings by 4,871 BTC last week; Toss plans to develop its own blockchain and issue a native cryptocurrency; OpenAI's CFO privately questioned the timing of the IPO in 2026

Research: Stablecoins have a trading volume of 35 trillion a year, how much of it is real payment?

Galaxy Research: AI agents are giving rise to new species on the blockchain, how zero-human companies activate the financial flywheel

Data Research: How big is the liquidity gap between Hyperliquid and CME crude oil?
Why Are GPU Prices Skyrocketing Out of Control?

How to Master Claude Cowork Completely?

70-Page Confidential Letter Alleges First Charge of 'Lying,' Altman Tells Board 'I Can't Change My Personality'
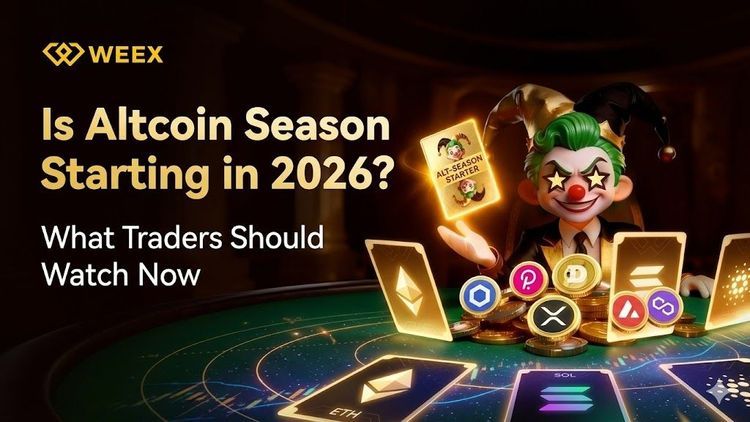
Is Altcoin Season Starting in 2026? What Traders Should Watch Now
Altcoin season signals are becoming clearer in 2026 as capital rotation across crypto markets accelerates. Here’s what traders should watch and how strategy-based participation is evolving in the current market cycle.
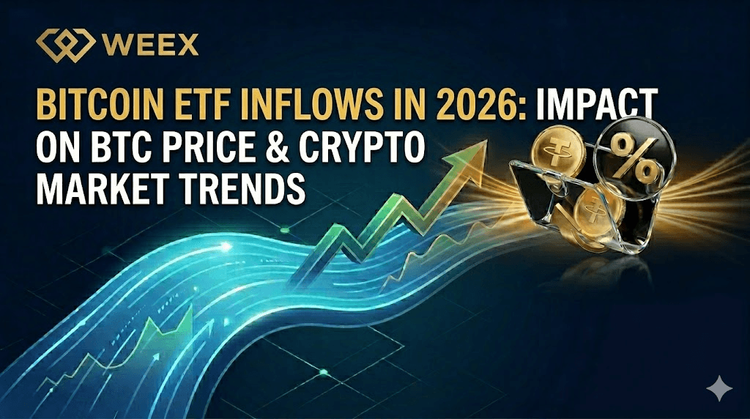
Bitcoin ETF Inflows in 2026: Impact on BTC Price and Crypto Market Trends
Bitcoin ETF inflows are reshaping BTC price trends and crypto market liquidity in 2026. See how institutional capital is influencing volatility, trading behavior, and portfolio allocation strategies across crypto markets.
Visa's Stablecoin Strategy: Cards, Settlement, and the Future

Stock Market Split

How to capture the next Alpha in the narrative of predictive markets?
How the US-Iran War Could Affect Oil and Bitcoin Prices (Latest Analysis)
The outbreak of the US-Iran war on February 28, 2026, has provided an unprecedented real-time laboratory for understanding how geopolitical oil shocks interact with an increasingly institutionalized cryptocurrency market. This article examines the relationship between crude oil prices and Bitcoin throughout the conflict, analyzing price movements, correlation patterns, and the underlying transmission mechanisms.