- Buy Crypto
- Markets
 Futures
- Spot
- Copy Trade
- Earn
- More
The market volatility continues. How to determine when the pullback is over?
Original Author: Murphy, On-chain Data Analyst
How to Determine if a Pullback is About to End?
There are many methods to determine if a short-term pullback is about to end. As mentioned before, analysis can be conducted from different perspectives such as chip structure, financial pressure, sentiment feedback, etc. Today, I will share another method that I often use and find very effective, which is to observe the cost basis changes of different time cohorts as a reference point.
Before discussing the logic, let's first look at a case study—the bottom judgment of a large cycle
In Figure 1 below, the blue line represents Long-Term Holder's Average Cost Basis (LTH-RPC), the red line represents Short-Term Holder's Average Cost Basis (STH-RPC), and the black line is BTC's price.
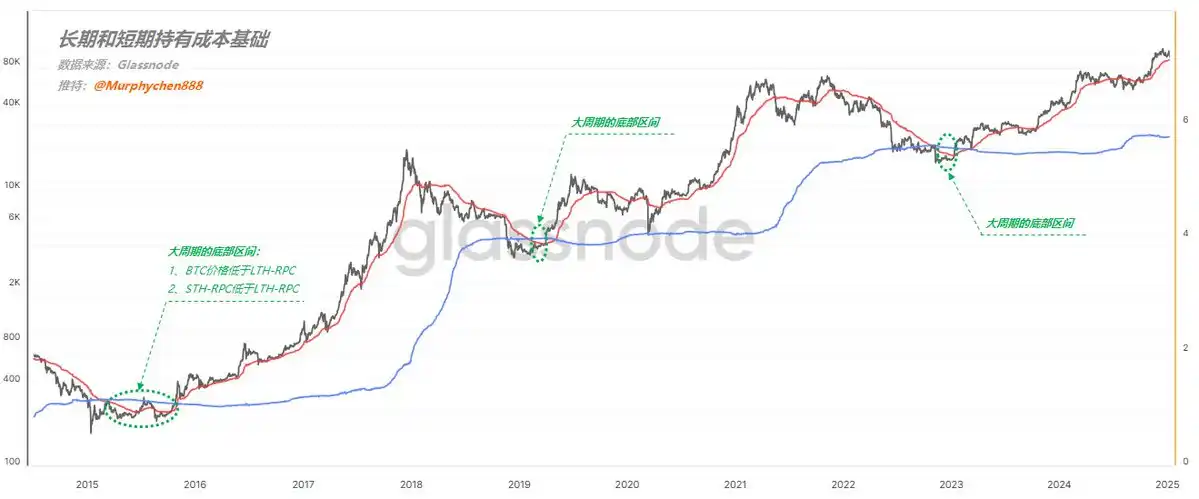
(Figure 1)
Pay attention to the area I have circled in green with a dotted line. As long as the following 2 conditions are met simultaneously:
- Condition 1, BTC price is below LTH-RPC
- Condition 2, STH-RPC is below LTH-RPC
This stage is the bottom range of the large cycle and is also an excellent opportunity to buy the dip!
The underlying logic is as follows:
First, when the BTC price falls below the LTH-RPC, it means that the average cost of long-term holders is at a loss. This indicates that the price is severely undervalued, and the market bubble has almost completely burst.
Second, in the vast majority of time, the longer the chip holding period, the lower the relative cost. Therefore, it is extremely rare for STH-RPC to be lower than LTH-RPC.
It indicates that during the price decline, there were a large number of loss-exiting short-term holders, but new short-term holders entered to buy the dip. After frequent turnover, the cost of short-term chips was actually pulled below the cost of long-term chips. This is a phase of oversold prices, signaling the bottom of the panic sentiment. Following the logic above, we can also apply the same reasoning to determine the duration of a bull market pullback.
Figure 2 below lists the cost bases for: 1d-1w (red line), 1w-1m (yellow line), 1m-3m (blue line), 3m-6m (purple line)

(Figure 2)
First, let's look at February to May 24th, which happens to be the process from the start of a trend to decay and a pullback. The entire process is accompanied by the widening and narrowing of the distance between the blue line and the red line (as indicated by the green arrows in the image);
Eventually, the blue line ran to the top, while the red line was at the bottom, meaning that the relative short-term cost of chips was lower than the relative long-term cost of chips. I call this phenomenon the "reverse arrangement structure" of long-term and short-term costs.
I marked three points in the image with orange dashed lines, all of which show the formation of a blue, yellow, red arrangement from top to bottom, or a purple, blue, yellow, red arrangement, representing the relative bottoms during pullbacks.
So, the current trend is also transitioning from rapid expansion to gradual contraction, but the blue line is still below. If we are to see a market restart in the short term, perhaps a "reverse arrangement structure" needs to be formed first. However, after this period of turnover, the blue line is already very close to the red and yellow 2 lines. As long as there is another period of consolidation, the structure can form, thereby meeting the conditions for forming a relative bottom.
PS: Of course, it would be best to form a purple, blue, yellow, red "reverse arrangement structure," but this would require a longer turnover time (at least 4-5 months).
Summary:
Based on the change in the cost base of different time groups as the basis for judging the time of a pullback, the higher the relative cost of long-term chips, the closer we are to the bottom once a blue, yellow, red "reverse arrangement structure" is formed from top to bottom. This indicates that turnover is sufficient, sentiment is close to the bottom, and the pullback time is coming to an end.
The content shared in this article is for communication and research purposes only and should not be construed as investment advice.
You may also like

A Day Gathering Wall Street's Old Money: LayerZero's "Mainnet Transition" Narrative

Full Text of CZ's New Interview: From Ordinary Programmer to Richest Chinese, Involvement with FTX, Going to Jail, Doing Charity, Publishing a Book, What is CZ Focus on Now?
Mr. Beast is officially entering the world of finance, the Gen Z's new banker

SBF Appeals from Prison, Files 35-Page Motion Accusing Trial of "Collusion"

Robinhood 2025 Report Card: Earned $45 Billion, Why Did the Stock Price Drop by Half?
$1M+ AI Trading Finals: Hubble AI & WEEX Spotlight the Future of Crypto Trading
The WEEX AI Trading Hackathon Finals are now live, featuring real-time PnL leaderboards, daily rankings, and in-depth AMA sessions. Explore how top AI trading strategies perform under real market volatility and follow the competition as it unfolds.

WEEX Alpha Awakens Final Round Has Officially Begun
Day 1 of the WEEX AI Trading Hackathon Final Round is now live! Watch top algorithmic trading strategies compete with real capital. Follow the action from Feb 3–16, 2026, with $880K+ in prizes. Tune in live now. #AITrading #TradingHackathon

WLFI Team Meeting, Ally Meeting, Seaside Villa Cryptocurrency Business Kickoff

OpenClaw Hackathon, What are some projects worth checking out

The Bithumb 2000 BTC Mistake: The Fundamental Issue with CEX Ledgers

LayerZero releases L1 chain Zero, CZ appears on the All-In podcast, what's the overseas crypto community talking about today?

Binance Alpha has turned the airdrop into a "blind box" game
AI Wars: WEEX Alpha Awakens - The Global AI Trading Hackathon Redefining Financial Markets
Compete in WEEX's global AI trading hackathon with $880K+ prize pool. Build & test algorithms in live markets. Bentley & crypto prizes await top AI trading strategies. Join now!

Kyle Samani's Exit Scam, Is There More to the Story?

February 10th Market Key Intelligence, How Much Did You Miss?

Tokenomics New Paradigm? When Backpack Starts Enabling VCs to "Deferred Gratification"

BankrCoin Achieves New Milestones as YZi Labs and ETH Investors Make Significant Moves
Key Takeaways BankrCoin (BNKR) hit a new all-time high with significant market activity. YZi Labs executed a major…

Bitcoin Tests $75K Amid Market Predictions
Key Takeaways Bitcoin shows a 47% chance to test the $75,000 mark this February, contrasting with a potential…
A Day Gathering Wall Street's Old Money: LayerZero's "Mainnet Transition" Narrative
Full Text of CZ's New Interview: From Ordinary Programmer to Richest Chinese, Involvement with FTX, Going to Jail, Doing Charity, Publishing a Book, What is CZ Focus on Now?
Mr. Beast is officially entering the world of finance, the Gen Z's new banker
SBF Appeals from Prison, Files 35-Page Motion Accusing Trial of "Collusion"
Robinhood 2025 Report Card: Earned $45 Billion, Why Did the Stock Price Drop by Half?
$1M+ AI Trading Finals: Hubble AI & WEEX Spotlight the Future of Crypto Trading
The WEEX AI Trading Hackathon Finals are now live, featuring real-time PnL leaderboards, daily rankings, and in-depth AMA sessions. Explore how top AI trading strategies perform under real market volatility and follow the competition as it unfolds.