
Goldman Sachs Q3 EPS Hits $17.01: What It Means for GS Stock

 Prefer us on Google

Goldman Sachs (NYSE: GS) reported third-quarter 2026 net revenue of $18.68 billion, net earnings of $5.29 billion and diluted earnings per share of $17.01. Annualized return on common equity reached 18.7%, while quarterly revenue was the second highest in the firm’s history.
Strong results did not produce a sustained earnings-day rally. GS stock opened higher before retreating, closing October 13 at $891.91, down 0.23%. The next question is whether trading and investment banking growth can support stronger future earnings expectations.
Readers tracking upcoming earnings can explore the WEEX U.S. stock earnings prediction event. Registered users can allocate points to bullish or bearish predictions, starting from one point. Submissions cannot be withdrawn, and rounds close 10 minutes before earnings. Goldman’s latest prediction window has already closed; other available rounds follow the event page.
Another activity, WEEX Dice Rush: Wall Street Tycoon, combines dice-based gameplay with stock predictions. Participation requirements, tasks and rewards follow the published rules.
Goldman Sachs Q3 Earnings: What Does $17.01 EPS Mean?
The results demonstrate substantial earnings capacity, but EPS should be evaluated alongside net income, share-count changes and revenue sources.
Key Metric | Q3 2026 Result |
|---|---|
Net revenue | $18.68 billion |
Net earnings | $5.29 billion |
Diluted EPS | $17.01 |
Annualized return on common equity | 18.7% |
Quarterly revenue ranking | Second highest |
Source: Goldman Sachs’ official earnings announcement.
Second-highest quarterly revenue reflects strong business activity. It does not establish that subsequent quarters will maintain the same level.
Results Exceeded a Reported Consensus Estimate
According to FactSet figures cited by Barron’s, analysts expected EPS of $12.86 and revenue of $16.83 billion. Goldman exceeded both estimates.
Consensus estimates vary between providers, so comparisons should identify their source.
What Drove Goldman Sachs’ Earnings?
Equity Trading Led Growth
Reuters reported that equity trading revenue increased 72% year over year to $6.44 billion. Investment banking fees rose 21% to $3.22 billion, while asset and wealth management revenue also grew.
The breadth of growth matters, although equity trading was particularly strong. Investors should watch whether client trading and financing demand remain elevated.
FICC Performance Was More Subdued
Fixed income, currencies and commodities revenue totaled $3.47 billion, down 1% year over year.
The quarter therefore showed uneven trading performance rather than strength across every business.
Investment Banking Remains Cyclical
Advisory and underwriting revenues depend on financing demand and completed transactions. Interest rates, valuation disagreements and market uncertainty can delay deals and revenue recognition.
In asset and wealth management, net inflows and recurring management fees are important measures of durability. These revenues help assess how much earnings depend on fluctuating trading activity.
GS Stock Price Analysis: Why Did Shares Reverse After Earnings?
Recent regular-session closing prices show that GS remained below $900 before the earnings announcement.
Date | Closing Price | Daily Change |
|---|---|---|
October 7, 2026 | $887.21 | −1.11% |
October 8, 2026 | $882.59 | −0.52% |
October 9, 2026 | $895.32 | +1.44% |
October 12, 2026 | $893.95 | −0.15% |
October 13, 2026 | $891.91 | −0.23% |
On October 13, GS opened at $923.00, reached $931.00 and fell to $891.01. Trading volume was approximately 4.94 million shares, compared with 2.06 million the previous session.
Closing near the session low suggests the early advance lacked sustained buying support. Higher volume indicates increased trading activity following the announcement.
Profit-taking, valuation concerns and broader market conditions may have contributed. One session cannot identify a single cause or confirm a long-term reversal.
These figures refer to underlying GS shares. WEEX stock tokens and futures have separate pricing mechanisms.
-- Price
GS Stock Forecast: Levels to Watch
The following scenarios interpret recent historical prices rather than provide guaranteed targets.
| Scenario | Condition | Reference Range |
|---|---|---|
| Recovery | Holding above $900–$906 with stronger volume | $923–$931 |
| Consolidation | Support near $880 without sustained upside | $880–$906 |
| Further weakness | A sustained break below approximately $880 | $868–$877 |
The ranges reflect recent session highs and lows, including earnings-day prices.
Higher earnings forecasts, sustained client activity and stronger market sentiment could support recovery. Falling trading revenue, expense pressure or slower capital markets activity could weigh on shares.
For related coverage, explore the Goldman Sachs Tokenized Stock (Ondo) price prediction. GSon should be distinguished from GS shares and WEEX Stock Spot 2.0.
What Risks Matter After Goldman’s Earnings?
Trading revenue fluctuates with client demand. Volatility can increase hedging activity, but extreme conditions may also cause clients to reduce exposure.
Investment banking revenue depends on transactions completing, while strong earnings do not automatically imply an attractive valuation. If optimistic expectations are already reflected in the price, even an earnings beat may produce only a temporary rally.
How to Access GS-Linked Products on WEEX
Step 1: Prepare Your Account and Funds
New users can register on WEEX and complete required account checks. WEEX offers spot, futures and TradFi services and publishes Proof of Reserves information.
If you already hold digital assets, select a supported asset and deposit network, obtain your WEEX address and transfer funds. Sending and receiving networks must match; include any required memo or tag. Prepare USDT for the selected product.
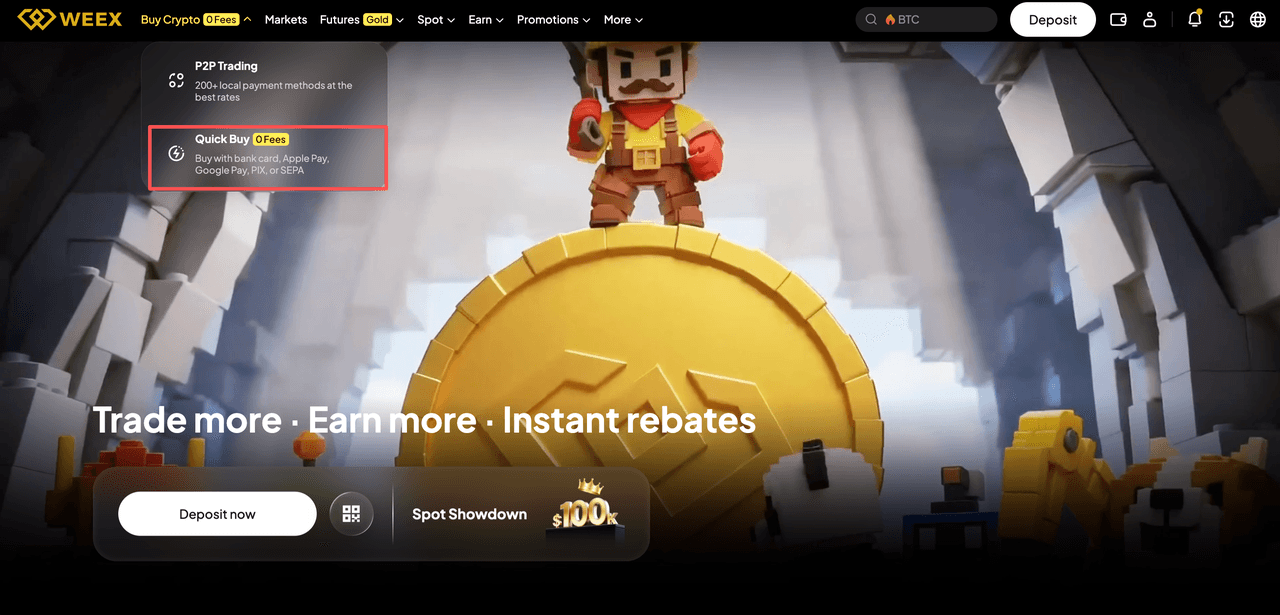
Otherwise, check WEEX Quick Buy or the WEEX P2P marketplace. Availability, payment methods and fees follow the displayed terms.
Step 2: Choose Stock Tokens or Futures
Open the GS/USDT stock token trading pair, or browse the WEEX stock token market.
WEEX Stock Spot 2.0 is distinct from Ondo, xStocks and other third-party tokenized assets. Its synthetic tokens track selected stock or ETF prices and trade using USDT without an external brokerage account.
Tokens do not represent underlying shares or confer shareholder status, voting rights, meeting participation, dividends or other shareholder benefits. Orders are not routed to Nasdaq, NYSE or external brokers. Execution prices are determined by WEEX’s corresponding market.
The Goldman Sachs Tokenized Stock (Ondo) buying guide covers a separate product category.
Alternatively, access the GS/USDT futures trading pair or the WEEX TradFi market. Futures involve margin, leverage and liquidation risk. Check current trading availability and rules.
Step 3: Review and Submit Orders
For stock tokens, enter the quantity, choose a supported Market Order or Limit Order, review pricing and fees, and submit.
For futures, select margin mode, leverage, Long or Short direction and position size. Consider Stop Loss and Take Profit settings, and review liquidation estimates, fees and funding rates.
FAQ
1. What was Goldman Sachs’ Q3 EPS?
Diluted EPS was $17.01, with net earnings of $5.29 billion.
2. Does strong earnings growth guarantee GS upside?
No. Earnings expectations, valuation and broader market conditions also influence prices.
3. Which GS price levels matter next?
Watch support near $880 and whether shares reclaim $900–$906.
4. Do WEEX GS tokens represent Goldman shares?
No. They are synthetic price-tracking assets without underlying ownership or shareholder rights.
5. Is Goldman’s latest earnings prediction still open?
No. Predictions close 10 minutes before earnings under the event rules.
Related Articles
This content is provided for general informational purposes only and doesn't constitute financial, investment, legal, or tax advice. Any events, rewards, online promotions, or related information mentioned herein should not be considered a recommendation, solicitation, or invitation to purchase, sell, trade, or otherwise deal in any crypto assets. Crypto assets are highly volatile and may result in loss. The availability of WEEX services, products, and related events may vary by region. You are responsible for ensuring that your participation is in accordance with applicable local laws and regulations.
You may also like

X100 and Arkadiko Governance Attack Review: Why Locking and Long Voting Periods Failed?

A Review of Global CEX Theft Incidents from 2014 to 2026

AI Selloff Survival Guide: How to Distinguish Between Buying Opportunities and Danger Signals?

Vitalik Buterin Identifies a Skill Where Humans Have an Advantage Over AI

Bitwise Report: Bitcoin Could Be the Best Performing Mainstream Asset of the Next Decade

Central banks map their role in a payments system shared with stablecoins

Circle starts cutting legacy USDC app transfer limits on October 31

[Column] The Message of ICE's Entry into the Perpetual Futures Market for Korea

Is the Autumn of Banking 'Coins' Just a Technological Showcase?

Mirae Asset Issues Tokenized Dollar Notes on Solana for Professional Investors

Will Strive, the Accelerated Cryptocurrency Hoarder, Become the Next Strategy?

唐华斑竹 Reveals SUN Token Buyback and Burn Data

Kamino Opens Solana Lending Market for Backpack Tokenized Equity Collateral

Singapore Police Reveal: At Least Two Cases of Physical Tampering with Ledger Hardware Wallets Resulting in Losses of Approximately S$35 Million

Hackers drain 9,400 SOL from bot wallets, and a copied key is blamed
AI Earnings Diverge, Tech Sells Off, BTC Breaks $80K | WEEX Weekly Recap (10.26-10.30)
WEEX’s weekly recap tracks AI investment, rate expectations, and crypto. The Nasdaq rose for two sessions early in the week, but concerns about inflation, GOOGL’s sharp drop, and weak after-hours reactions to AMZN and INTC pushed volatility higher. BTC briefly fell below $80,000. As of the morning of October 30, the ECI, Chicago PMI, and XOM and CVX earnings were still pending.

Why is Amazon's Cash Flow Decreasing Despite AWS's Growing Profits?

How Does Coinbase Make Money Amidst a Trading Slowdown?

Blockchain Revenue Expected to Decrease by 28% in 2026, Predictive Markets and RWA to Grow - Survey

Major Indexes Close Lower as Tech Comes Under Pressure | WEEX TradFi Daily(October 30, 2026)
All three major indexes closed lower on October 29, led down by technology and communication services; healthcare and defensive sectors were relatively resilient. Amazon and Intel came under pressure after hours. HYPE continued to rally toward its record high. TRX rose against the broader crypto-market decline. Investors will watch pre-market earnings from AbbVie, Exxon Mobil, Chevron and others on October 30.

Google Cloud Previews Institutional Crypto Key-Security Service as Custody Risks Grow

Cryptocurrency Market Makers: Distinguishing the Real from the Fake – Tiger Research

Robinhood Crypto Revenue Falls 55% as Prediction Markets Support Growth
SBI Shinsei Trust Bank to Merge with Cryptocurrency Trust Company in December

Gold or US Treasuries: Which is the Better Hedge?

Controversy over Gold: BCRA Revealed How the Operation with the Metal Was Questioned by AGN
Silicon Valley shifts AI funding to crypto using an Ethereum ICO blueprint
Boundless Offers AI with Denial Response Removed under Review System for ZK Proofs

Circle and ACI Bring USDC Settlement Into Latin American Payment Operations

a16z Survey of 100 CISOs: Why is Cybersecurity Budget Experiencing a 'Revenge' Growth in the AI Era?
X100 and Arkadiko Governance Attack Review: Why Locking and Long Voting Periods Failed?
A Review of Global CEX Theft Incidents from 2014 to 2026
AI Selloff Survival Guide: How to Distinguish Between Buying Opportunities and Danger Signals?
Vitalik Buterin Identifies a Skill Where Humans Have an Advantage Over AI
Bitwise Report: Bitcoin Could Be the Best Performing Mainstream Asset of the Next Decade
Central banks map their role in a payments system shared with stablecoins