Why Is Quant (QNT) Crypto Up Today? What Price and Volume Really Show

 Prefer us on Google


Why Is Quant (QNT) Crypto Up Today? What Price and Volume Really Show
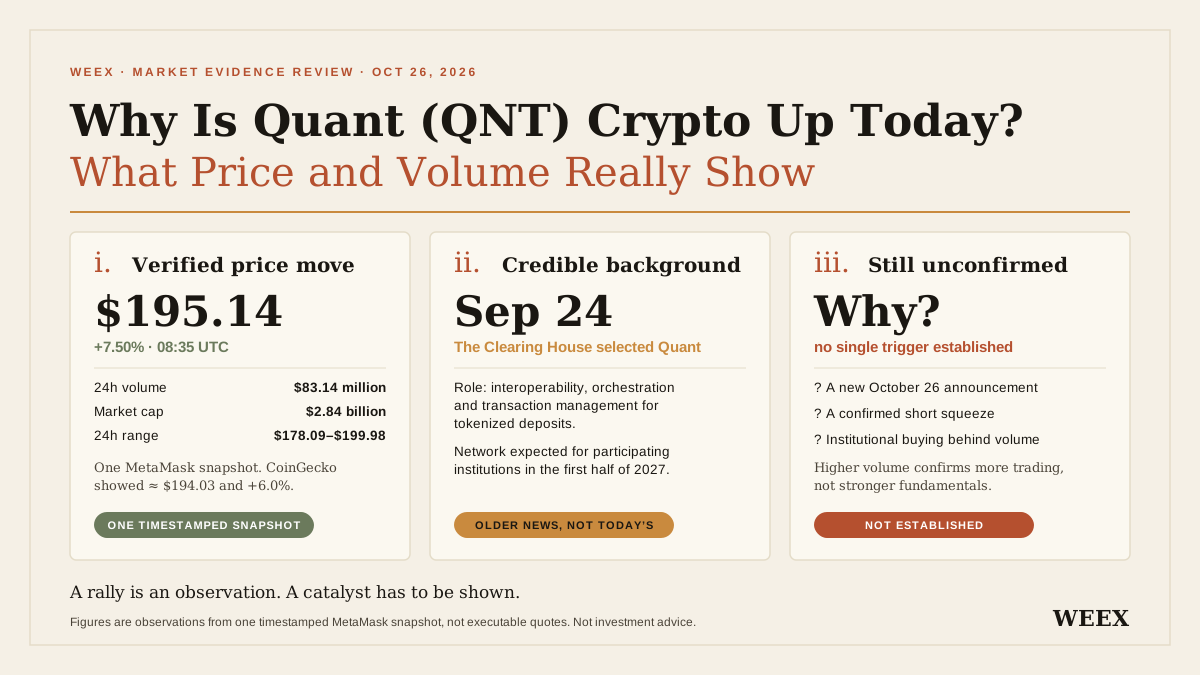
Quant (QNT) is rising on October 26, 2026, against a backdrop of investor interest in its banking and tokenized-deposit infrastructure. However, the evidence does not establish a single new announcement as the cause of today’s move. MetaMask’s timestamped snapshot placed the token at $195.14, up 7.50%, at 08:35 UTC. The important distinction is between a verified price increase, a credible longer-term business narrative, and an unproven explanation for the latest buying.
Our assessment is that the rally deserves attention, but the strongest analysis starts with what remains unconfirmed. Repeating an older bank partnership as “today’s catalyst” creates a misleading timeline. Equally, a growing payments business does not automatically tell investors how much additional demand its token will capture.
For readers following the move on WEEX, the official Quant perpetual-futures destination and Quant spot destination provide the relevant pair links. Live order availability, funding and executable quotes should be checked in the trading interface: the publicly retrieved pages did not provide enough functioning market data to verify those conditions during this review.
【Cover Image ALT: Quant (QNT) rally analysis separating verified price gains, trading activity, institutional developments and unconfirmed causes】
What Is Happening to Quant (QNT) Price Today?
The available market snapshots confirm an upward move, but their figures should not be blended into a single supposedly precise live price. Different providers update at different times and may use different exchanges, reference currencies and aggregation methods.
The following figures belong to one timestamped MetaMask snapshot rather than a mixture of feeds.
| Metric | Reported Reading |
|---|---|
| Observation time | October 26, 2026, 08:35 UTC |
| Price | $195.14 |
| Reported daily change | +7.50% |
| Reported 24-hour trading volume | $83.14 million |
| Market capitalization | $2.84 billion |
| Reported 24-hour range | $178.09–$199.98 |
Source: MetaMask’s Quant market page. Figures are observations, not executable quotes.
A separate CoinGecko retrieval showed approximately $194.03 and a 6.0% headline gain. Its page also displayed a different percentage in another return module, reinforcing why individual fields should be checked before combining them. The source did not provide an exact data timestamp for the retrieved snapshot.
For trading decisions, consistency matters more than selecting whichever percentage makes the strongest headline. Use one venue, one quote currency and matching observation times when calculating returns.
A rolling 24-hour gain also differs from performance since midnight. If the starting point falls during a previous sell-off, the percentage can increase even when the latest price is barely changing. That does not invalidate the move, but it changes what “up today” actually describes.
Why Is Quant (QNT) Going Up? Separate the Narrative From the Trigger
The most defensible explanation has two parts: Quant has a substantive institutional-development story, while the immediate trigger for this particular rally remains unresolved.
That distinction matters because markets continually reprice existing information. A partnership can attract renewed attention weeks after publication as traders reassess its implications, positioning changes or liquidity conditions improve. Such a move does not require a fresh announcement.
Conversely, the existence of a credible partnership does not prove that it caused every subsequent green candle.
The Banking Partnership Is Real, but It Is Older News
On September 24, 2026, The Clearing House announced that it had selected Quant to support its On-Chain Money Initiative. Quant’s role covers interoperability, orchestration and transaction management for a network intended to clear and settle tokenized deposits, including connectivity with existing payment infrastructure.
This is meaningful evidence of commercial positioning. Importantly, it comes from the counterparty as well as Quant itself.
It is not an announcement first made on October 26. An accurate article should identify the original date rather than allow renewed circulation to make an older development appear new.
Recent Commentary Supports the Theme, Not a Proven Trading Cause
Quant’s October 22 conference recap discussed the practical challenges of connecting tokenized-deposit networks. Its account emphasized legal frameworks, controls, common standards and participation across institutions.
Those issues help explain the investment narrative: interoperability becomes valuable when separate financial networks need to transact with one another.
They do not establish who bought the token today, how much they purchased or why they entered at a particular hour. Conference commentary is business context, not a transaction-level explanation of exchange demand.
A Price Move Can Remain Partly Unexplained
A useful market article can identify an evidence boundary without inventing a catalyst to fill it.
Proving an immediate cause would require stronger material, such as a time-matched announcement followed by observable trading changes, disclosed institutional purchases, or a documented liquidation sequence. Even then, other influences could contribute.
The appropriate conclusion here is narrower: institutional developments provide a credible background, but the reviewed primary materials do not establish a new October 26 event as the sole driver.
Does Trading Volume Confirm the Quant (QNT) Rally?
Trading volume helps assess participation, but it cannot identify buyers’ motives by itself.
CoinGecko reported approximately $82.52 million in 24-hour volume and an 82.60% increase from the preceding period. That supports the conclusion that activity increased on its reported comparison. It does not prove institutional accumulation or show that purchases came from banking customers.
Three separate questions should guide the analysis.
Is Activity Higher Than a Comparable Baseline?
Compare like with like. An exchange’s spot volume should be compared with its own earlier spot volume. An aggregate market figure should be compared with an earlier aggregate calculated using the same methodology.
A rolling 24-hour total and a UTC calendar-day total can differ substantially. Comparing them without identifying their windows can produce a false impression of acceleration or weakness.
A practical baseline is the median of several recent comparable periods. The median reduces the influence of an unusually large event day. It still does not establish causation, but it helps distinguish routine activity from a meaningful change.
Is the Move Broad Across Trading Venues?
A rally visible across several liquid spot markets is different from a sharp jump on one thin order book.
Check whether other venues show similar prices, whether spreads remain manageable, and whether quoted depth persists after trades execute. A high displayed price is less useful if a normal-sized sale would push execution materially lower.
Agreement across venues improves confidence that the move reflects a broader market repricing. It does not reveal whether the buyers are long-term holders, short-term traders or market makers adjusting inventory.
Does Buying Persist After the Initial Burst?
A sudden volume spike can accompany durable demand, profit-taking or a brief liquidation cascade. The next observation matters.
If price holds after activity normalizes, buyers may be absorbing available supply. If the move quickly reverses as turnover fades, the initial spike offers weaker evidence of lasting demand.
These are interpretations to test through subsequent observations, not conclusions available from one screenshot.
Higher volume confirms more trading activity. It does not independently confirm stronger fundamentals.
-- Price
Is Quant (QNT) Outperforming the Wider Crypto Market?
A token can rise because the whole market is recovering, because it has a distinct catalyst, or because both forces are operating together.
To measure relative strength, compare returns over matching windows. A dollar-price chart alone cannot establish whether an asset is attracting unusually strong demand.
For example, suppose a token rises 6% while a benchmark falls 1% during the same period. The percentage-point difference is seven points. Its return relative to the benchmark is:
This is a hypothetical example, not a synchronized observation of today’s market.
The distinction matters when comparisons are close or repeatedly compounded. Subtracting returns is a convenient summary; dividing growth factors measures the actual change in the price ratio.
For a practical check, use matching candles from the same provider. If the token rises in dollars but falls against the benchmark, its apparent strength may largely reflect a market-wide rebound.
A persistent improvement in both measures would support a stronger relative-performance argument. It would still leave the question of valuation unanswered.
Does the Banking Partnership Automatically Increase Quant (QNT) Demand?
No. A technology partnership establishes commercial relevance, but token demand depends on the specific economic mechanism connecting adoption with purchases, holdings or staking.
Quant’s service terms define QNT as a utility token used for its products and services, including staking. They also define fees through customer plans, dashboards and order forms. Those general terms do not provide the commercial economics of every individual partnership.
This leaves several links for investors to verify.
| Link in the Investment Thesis | Evidence That Would Strengthen It |
|---|---|
| Institutions adopt the technology | Named participants, production availability and documented use |
| Adoption creates economic activity | Transaction counts, service usage or disclosed customer spending |
| Activity requires the token | Current product-specific payment, gas or staking requirements |
| Requirements affect tradable supply | Observable purchases, holdings, staking or lockup arrangements |
| Demand supports valuation | Sustainable demand relative to available supply and existing expectations |
The table is an analytical framework, not a claim that all these conditions have already been met.
Payment Value Is Different From Token Demand
Suppose a hypothetical network settles $10 billion each day. That does not mean customers must buy $10 billion of its associated token.
Payments may move as bank deposits while a separate infrastructure layer charges relatively small service fees. Some fees may depend on transaction counts rather than the monetary value transferred. The same token inventory might also be reused repeatedly.
A useful conditional model is:
If hypothetical token-payable spending were $100,000 per day and users held three days of inventory, the implied inventory value would be $300,000. This is an illustration of working-capital demand, not an estimate for Quant or its customers.
The model deliberately leaves out staking, speculative holdings, treasury policies and changes in supply. Its purpose is to expose the missing assumptions before anyone converts a large settlement headline into a token-price target.
Company Success and Holder Rights Are Separate Questions
Blockworks’ transparency compilation describes licensing, rollup execution and staking functions while also noting that holding QNT does not provide company ownership, dividends or governance rights. The compilation is based on disclosed material and is not an independent audit of every claim.
An investor therefore needs two theses: why the infrastructure business should succeed, and why that success should improve the token’s economics at the current price.
Conflating them makes the investment case look more complete than the evidence allows.

What Does the Official Launch Timeline Actually Say?
The counterparty announcement provides a useful check on more precise claims circulating in summaries.
The Clearing House’s September release said the network was expected to become available to participating institutions in the first half of 2027. It did not announce that the new network was already processing its existing payment-system volumes.
A first-half target is also broader than a specific second-quarter commitment. An article should retain the original wording unless a newer primary announcement narrows it.
This distinction creates a practical monitoring schedule. Investors should look for evidence of participant onboarding, production readiness, operating arrangements and actual usage as the expected availability window approaches.
An expected launch remains a forward-looking milestone. Delivery can validate part of the business thesis, but a launch date alone says little about the speed of customer adoption.
Quant’s own conference recap also points to an important constraint: implementation depends on legal arrangements, risk controls and coordination, alongside technology.
That is why the strongest follow-up article would examine operational progress rather than simply republish the same partnership announcement with a new price.
How Should Traders Analyze Quant (QNT) Without Inventing Technical Levels?
Support and resistance should come from identifiable trading behavior. A round number or a previously quoted target is not sufficient evidence.
For this review, a complete, synchronized candle series was not reconstructed. Consequently, assigning precise moving averages, RSI readings or a definitive breakout target would create false precision.
Readers can still apply a reproducible process to a live chart.
Start by selecting the trading venue, pair and timeframe. A spot chart and a perpetual chart may differ around volatile periods. A four-hour candle can also tell a different story from an unfinished daily candle.
Next, mark repeated reaction areas rather than isolated points. A price region tested several times has a stronger observational basis than a single brief wick.
Then examine what happens after the level is crossed. Sustained trading above a prior reaction area provides different evidence from a momentary push followed by an immediate reversal.
Finally, define what would invalidate the interpretation. If every decline is described as a buying opportunity and every rise as confirmation, the thesis cannot be tested.
A Worked Trade-Planning Example
Consider a hypothetical entry at $195, an intended exit on weakness at $185 and an upside reference of $215.
The planned downside is $10 per token; the potential upside is $20. That creates a nominal 2:1 reward-to-risk ratio before costs.
If the maximum planned loss is $100, the position size would be:
This is arithmetic, not a recommendation or a verified support-and-resistance map.
Execution costs reduce the ratio, and a stop order may fill beyond its trigger during a fast move. Futures positions introduce margin and liquidation constraints that can interfere with the intended exit.
The purpose of the calculation is to make the consequences explicit before opening a position.
Could Derivatives Be Amplifying the Quant (QNT) Move?
Derivatives can amplify price changes, but calling a rally a “short squeeze” requires evidence of forced short-position closures.
Open interest measures outstanding contracts, while funding reflects the mechanism used to keep perpetual prices aligned with their reference market. Neither statistic, viewed alone, identifies the cause of a price move.
Dollar-denominated open interest also changes when the underlying price changes. An increase in its dollar value does not necessarily mean the same percentage increase in outstanding contracts.
A defensible squeeze analysis would align price changes, contract or base-unit open interest, liquidation records and funding over the same interval. It would also identify which exchanges the data cover.
If prices rise while open interest falls, short covering is one possible interpretation. Voluntary position closures and mixed activity can produce similar observations. A liquidation record would strengthen the forced-covering explanation.
For this article, the evidence reviewed is insufficient to attribute the move specifically to a market-wide short squeeze. That remains a hypothesis to investigate.

How to Follow Quant (QNT) on WEEX: Futures, Spot and Fees
WEEX has official destinations for Quant perpetual futures and Quant spot trading. During this review, the retrieved futures page lacked usable live quotes and displayed a restriction notice; the spot retrieval also lacked a functioning order book. These observations do not establish the status of every account or interface, but they prevent a confident claim that orders were immediately executable. (Start Quant futures trading on WEEX)
Begin with the futures destination if that is the product you intend to use. Confirm that the contract accepts orders and shows current prices before assessing direction, margin requirements, funding and exit conditions. If a restriction notice appears, follow the platform’s announcement guidance.
For direct token exposure, check the spot destination separately. Unleveraged spot holdings have price risk, while a margined derivatives position also has liquidation risk.
The WEEX Quant resource page links to relevant price and trading tools. Match any displayed timestamp to your analysis window rather than combining older informational figures with a current executable quote.
Are the Earlier Rewards and Zero-Fee Offers Still Available?
WEEX’s September 29 announcement described a promotional window ending October 6 at 14:00 UTC+8. That historical announcement is not evidence of an active October 26 reward or fee waiver.
No current QNT-specific campaign extension or fee discount was verified in this review. Check the official campaign terms for any updated eligibility window, and use the WEEX fee schedule plus the order interface for applicable charges.
An accessible campaign page does not, by itself, mean registration remains open.
WEEX Editorial View: Demand Evidence Before Paying for the Story
Quant has a credible infrastructure narrative, supported by a named counterparty and a clearly described role in tokenized-deposit connectivity. That deserves more weight than an anonymous partnership rumor.
The weakness lies in the shortcuts often used to translate that narrative into a trading conclusion. An older announcement is not automatically today’s catalyst. Settlement value is not token-buying volume. Increased activity does not identify institutional accumulation, and a rising chart does not resolve valuation.
Our view is that the best case for following this rally rests on measurable progress: production delivery, participating institutions, observable usage and clearer token-demand economics. Until those links strengthen, the rally is a market repricing worth monitoring—not proof that every optimistic assumption has been validated.
FAQ
1. Why Is Quant (QNT) Crypto Going Up Today?
The token is rising against a background of interest in Quant’s institutional payments infrastructure. However, the reviewed evidence does not establish one new October 26 announcement as the immediate cause. Separate the observed rally from explanations that remain hypotheses.
2. Did Quant (QNT) Announce a New Bank Partnership Today?
The Clearing House partnership discussed here was announced on September 24, 2026. It should not be presented as a new October 26 announcement. Later commentary may renew interest without changing the original event date.
3. Does the Clearing House Partnership Guarantee Higher Token Prices?
No. Commercial adoption can strengthen a business narrative, but token valuation depends on demand mechanisms, available supply and expectations already reflected in price. Large payment-system volumes cannot be converted directly into token purchases.
4. Is the Quant (QNT) Rally a Confirmed Short Squeeze?
Not on the evidence established in this review. A stronger conclusion would require time-matched liquidation records, open-interest changes and price data across identified venues.
5. How Can I Check Quant (QNT) Trading and Fees on WEEX?
Open the official futures pair first, then the spot pair if you want direct token exposure. Verify live order availability and account eligibility, and review current fees. Do not assume that a previously advertised promotion remains active.
Sources
| Source | Material Reviewed |
|---|---|
| MetaMask | Timestamped Quant market snapshot, October 26, 2026 |
| CoinGecko | Quant market and volume readings, accessed October 26, 2026 |
| The Clearing House | Partnership announcement, September 24, 2026 |
| Quant | Tokenized Markets and Money Conference recap, October 22, 2026 |
| Quant Service Terms | Utility-token and commercial-service definitions |
| Blockworks | Quant transparency compilation and disclosure limitations |
| WEEX | Historical promotion announcement and dates |
This content is provided for general informational purposes only and doesn't constitute financial, investment, legal, or tax advice. Any events, rewards, online promotions, or related information mentioned herein should not be considered a recommendation, solicitation, or invitation to purchase, sell, trade, or otherwise deal in any crypto assets. Crypto assets are highly volatile and may result in loss. The availability of WEEX services, products, and related events may vary by region. You are responsible for ensuring that your participation is in accordance with applicable local laws and regulations.
You may also like

Diverging Sentiment in Altcoins: How Whales Operate Amid Market Panic

The New PayPal Mafia: 10 Interns, $100 Billion
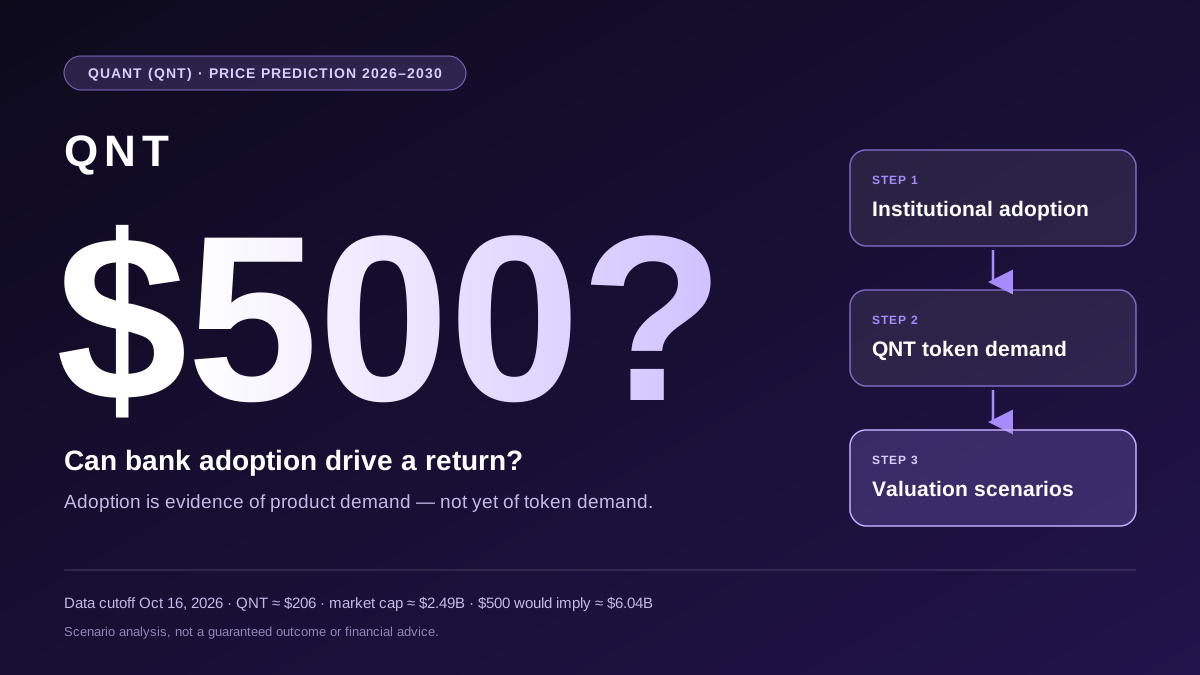
Quant (QNT) Price Prediction 2026–2030: Can Bank Adoption Drive a Return to $500?

DeepSigma launches RWA perpetuals demo with 77 traditional markets

UK banks eye faster settlement as 71% expect tokenization to reshape finance

The crypto job market accelerates: job postings triple to 1,241 in three months

QNT Price Surged 5x in September: Can Quant Actually Break $400
QNT price climbed from around $60 to as high as $372 in September before settling near $300, a move driven by Quant's selection for a major U.S. banking initiative. With RSI above 81 and a founder linked wallet moving millions in tokens, the next move hinges on whether $400 gets absorbed or rejected.

Mr&强 Claims QNT Rises 300% in a Week, Driven by Buying in Europe and the US

QNT Price Prediction October 2026: Can Quant Stay Above $300?
QNT price prediction for October 2026: Explore Quant’s Clearing House catalyst, recent rally, key support and resistance levels, and whether QNT can stay above $300.
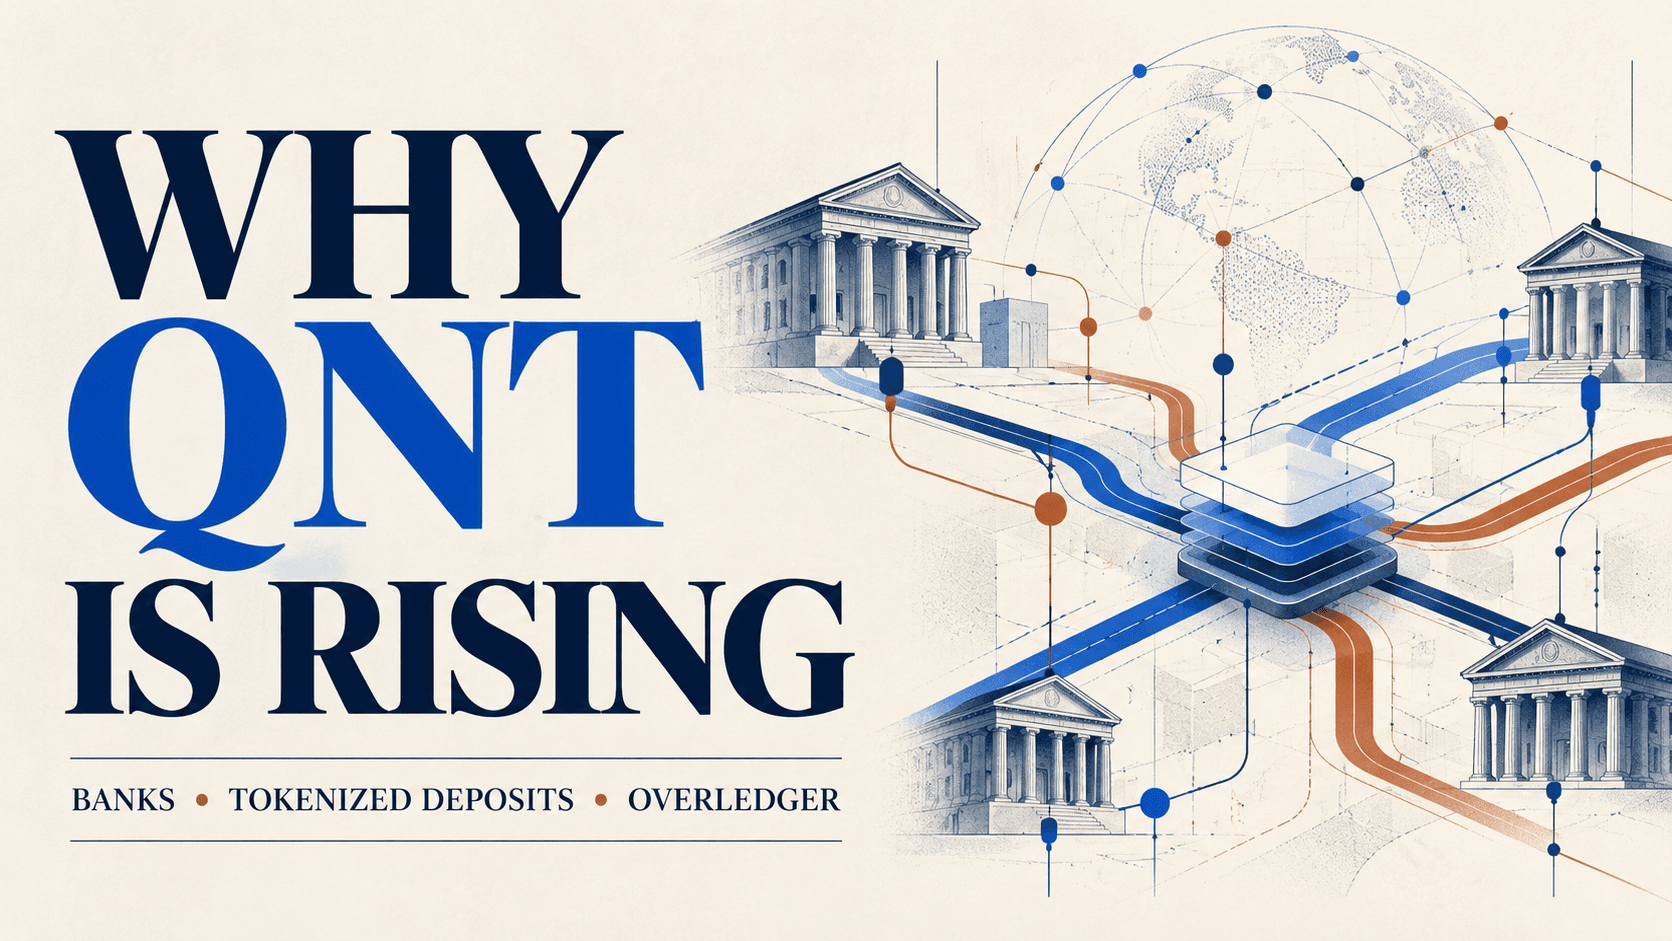
Why Is Quant (QNT) Price Rising? The Clearing House Tokenized Deposit Deal Explained
Why is Quant (QNT) rising? Explore The Clearing House tokenized deposit deal, QNT utility, price risks and how to trade QNT on WEEX.

Quant Secures Major Deal with US Clearing House: What Comes After the 300% Surge?
QNT Token Has Surged Sharply in a Week: What The Clearing House Deal Does and Doesn't Mean for Holders
QNT jumped after The Clearing House picked Quant to build a bank tokenized deposit network. The announcement is about the company, and how it reaches the token has not been disclosed.

Quant Provides Technical Support for The Clearing House's Tokenized Deposit Clearing Network

The Clearing House Selects Quant for US Tokenized Deposit Network

Seven UK Banks Complete First Interbank Tokenized Pound Deposit Transaction

The Clearing House Chooses Quant to Support Tokenized Deposit Technology
WEEX AI Wars II: Round 2 Recap — Humans Just Broke the Leaderboard (Literally)
Round 2 of WEEX AI Wars II has closed, and Team Human didn't just win again — they posted returns north of 50,000%. Here's the full breakdown, how the gap to Team AI widened even further, and how to join Round 3's live $20,000 USDT prize pool.

WEEX AI Wars II: Round One Is Over, The War Has Just Begun
Round 1 of WEEX AI Wars II has closed with humans dominating the top of the leaderboard. Here's the full breakdown of the results, what's coming in Round 2, and how anyone — trader or spectator — can still get in on the action and start earning rewards.

Killa: Bitcoin Prices Move Ahead of Macroeconomic Changes

Cryptocurrency Arbitrage and Price Scanning: How Quants Identify Inefficiencies in Funding Rates and Spreads Using Trading APIs
The Leverage Frenzy of Borrowing to Invest in Stocks: Why Wall Street is Paying Attention to the Sharp Decline in the Korean Stock Market

Bitfire launches compliant crypto quant strategy as RWA assets top HK$2B

Jane Street Loses $15 Billion in July Due to AI Fund Collapse

Scale Labs Unveils AI Prediction Market Sandbox Agent Fit

Helio Protocol's XAUT ecosystem has reached a strategic cooperation with Dephy and APRO

Trump appoints Todd Blanche, the author of the cryptocurrency enforcement memorandum, as acting Attorney General
Polymarket Fee Surge Explained: Where Did 90%+ of Extreme Fees Come From?

Founder of DeepSeek's magic square quantitative strategy achieved a 56.55% return last year, with assets under management exceeding 700 billion yuan

Champion Crowned at WEEX AI Hackathon: Revealing Strategy That Won $600K
A trader with only 6 months of AI trading experience won $600,000 at the WEEX AI Hackathon. Discover the strategy, tools, and lessons behind this breakthrough victory.

From CTA to AI: The Evolution of Adaptive Quant Strategies in Crypto Markets
Explore how an LLM-powered AI market-neutral trading strategy achieved a 2.75 Sharpe ratio with controlled drawdown. Inside crypto_trade’s adaptive hedging system at the WEEX AI Trading Hackathon.
Diverging Sentiment in Altcoins: How Whales Operate Amid Market Panic
The New PayPal Mafia: 10 Interns, $100 Billion
Quant (QNT) Price Prediction 2026–2030: Can Bank Adoption Drive a Return to $500?
DeepSigma launches RWA perpetuals demo with 77 traditional markets
UK banks eye faster settlement as 71% expect tokenization to reshape finance
The crypto job market accelerates: job postings triple to 1,241 in three months