
Ethereum Price Near $1,800: What Could Confirm an Ethereum (ETH) Rebound?

 Prefer us on Google



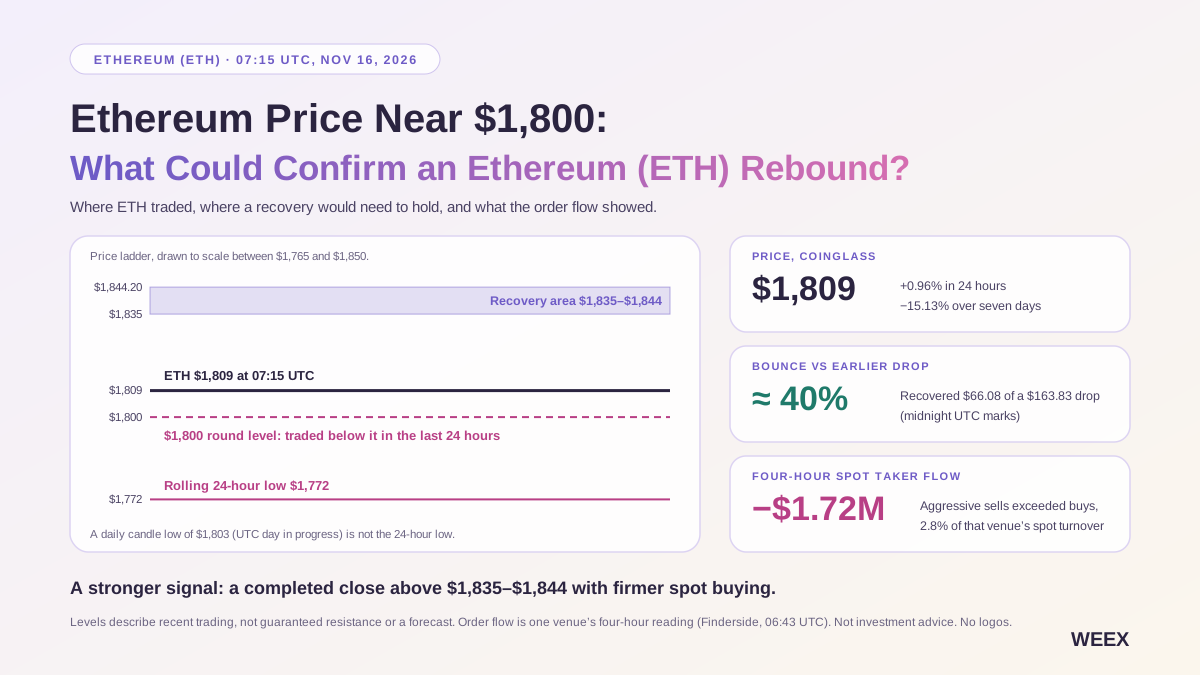
The Ethereum price was $1,809 at 07:15 UTC on November 16, 2026, up 0.96% over 24 hours but down 15.13% over seven days, according to CoinGlass. An earlier November 16 daily candle showed a low near $1,803, while the broader rolling 24-hour range extended down to $1,772. The longer window matters: ETH had traded below $1,800, and a move back above it did not by itself establish that the selloff was over.
The clearest test came from a four-hour comparison of spot and perpetual trading on the same venue. Aggressive spot sellers still outweighed aggressive buyers, even though ETH was up on the rolling 24-hour measure. Broader derivatives data showed more short liquidations than long liquidations, but those figures cover a different window. The evidence leaves room for short covering to have helped the bounce. It does not yet show that persistent spot buying can sustain it.
Key Takeaways
- ETH recovered about 40% of the preceding dollar decline in the weekend’s midnight UTC price series. That was a meaningful bounce, but most of the earlier decline remained unrecovered.
- The four-hour spot order-flow reading was negative. At a 06:43 UTC observation, aggressive spot selling exceeded aggressive buying by about $1.72 million, or 2.8% of measured spot volume on the venue tracked.
- Short liquidations were larger than long liquidations in the broader 24-hour snapshot, at $31.27 million versus $22.24 million. That does not establish what drove the specific four-hour move.
- U.S. spot Ethereum ETFs took in a net $2.3 million on Friday, November 13, while the full week still recorded $398.9 million of net outflows.
- The rebound would look stronger if ETH held above the recent $1,835–$1,844 area with improving spot volume and buy-side order flow, rather than making a brief move on liquidations alone.
Cover image ALT: Ethereum price near $1,800 on November 16, with a chart marking the recent $1,772 low and $1,835–$1,844 recovery area.
Market data through November 16, 2026, at 07:15 UTC. Four-hour order flow, rolling 24-hour data, and U.S. ETF sessions are labeled separately.
Why Was the Ethereum (ETH) Price Near $1,800?
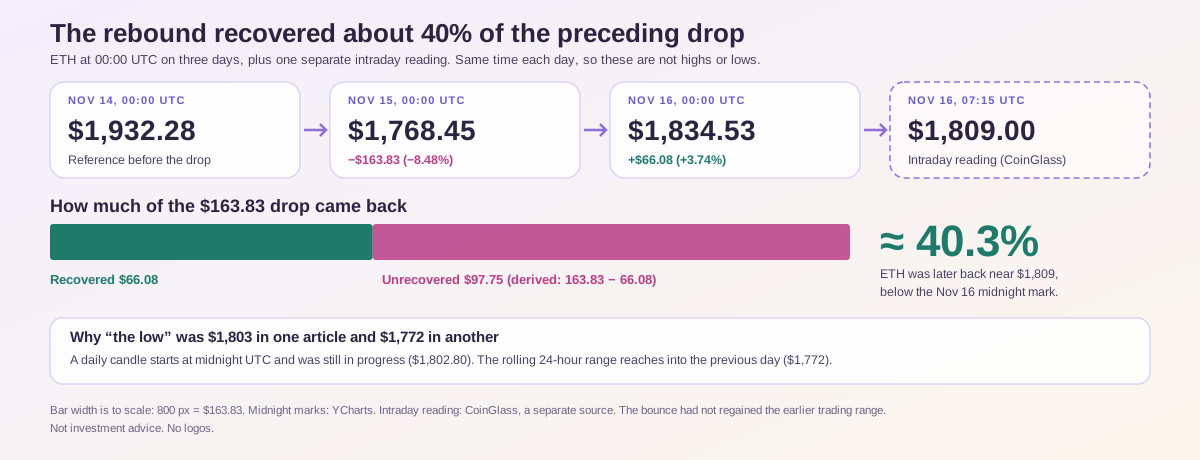
The weekend recovery came after a much larger move down. YCharts’ midnight UTC Ethereum series shows ETH at $1,932.28 on November 14, $1,768.45 on November 15, and $1,834.53 on November 16. These are daily marks at a consistent time, rather than intraday highs and lows.
| Observation | Ethereum price | What it shows |
|---|---|---|
| November 14, 00:00 UTC | $1,932.28 | Reference point before the next leg down. |
| November 15, 00:00 UTC | $1,768.45 | A decline of $163.83, or about 8.48%, from the prior midnight mark. |
| November 16, 00:00 UTC | $1,834.53 | A rebound of $66.08, or about 3.74%, from the previous mark. |
| November 16, 07:15 UTC | $1,809.00 | A separate intraday reading from CoinGlass. |
The rebound recovered $66.08 of the earlier $163.83 decline, or about 40.3%. ETH was later back near $1,809. So even before asking who bought, the price sequence showed that the bounce had not regained the earlier trading range.
There is also a reason different articles reported different lows. One CoinGlass daily candle showed a November 16 low of $1,802.80 while that UTC day was still in progress. The later rolling 24-hour range included $1,772. The daily candle starts at midnight UTC; the rolling range reaches into the previous day. The $1,803 figure is useful for discussing the opening part of Monday’s session. It cannot be used to claim ETH never traded below $1,800 in the preceding 24 hours.
Market coverage of the broader selloff pointed to higher yields, a firmer dollar, and tighter monetary-policy expectations. Those conditions are relevant to risk appetite. They do not establish which orders moved ETH off its low. For that question, the best starting point is what spot and perpetual traders did over the same hours.
Was the Ethereum (ETH) Bounce Driven by Spot Buying or Short Covering?
A Finderside market snapshot at 06:43 UTC showed four-hour ETH/USDT taker flow for spot and perpetual futures on the same venue. Taker flow is aggressive buy volume minus aggressive sell volume. A negative figure means the orders crossing the spread to sell represented more volume than the orders crossing it to buy. Every trade still has a buyer and seller. This measures who was more aggressive, not how much money entered or left the venue.
| Same four-hour window ending around 06:43 UTC | Spot ETH/USDT | ETH/USDT perpetual |
|---|---|---|
| Reported turnover | $61.12M | $991.32M |
| Aggressive buys minus aggressive sells | −$1.72M | −$7.91M |
| Imbalance as a share of turnover | −2.8% | −0.8% |
The perpetual market had a larger dollar imbalance because it traded much more volume. As a share of turnover, however, the spot imbalance was more negative. In this slice of trading, neither market showed positive net aggressive buying. That weakens the case that buyers were broadly chasing the rebound, particularly in spot. It does not rule out demand from passive bids or on other venues. A price can rise even with a negative taker imbalance if resting buyers absorb sales, the order book shifts, or activity elsewhere leads the market.
What the broader futures data adds
At 07:15 UTC, CoinGlass’s cross-market snapshot showed $2.31 billion of tracked spot turnover and $32.25 billion of futures turnover over the preceding 24 hours. Futures turnover was about 14 times spot turnover. Dollar-denominated futures open interest was $22.06 billion, up 1.54% over 24 hours, while weighted funding was slightly negative at −0.0021%. Reported ETH futures liquidations totaled $53.51 million, including $31.27 million in shorts and $22.24 million in longs.
Shorts accounted for about 58% of the tracked liquidations in that snapshot. Forced short exits can contribute to buying pressure as prices rise. But the liquidation numbers do not capture every voluntary position closure, and they do not identify what happened inside the four-hour spot window above. The broader data also showed higher dollar open interest over 24 hours. That does not disprove some short covering; it does make a simple story of market-wide positions being closed an incomplete explanation. New contracts may have opened while other positions were being closed, and changes in ETH’s price can affect the dollar value of open interest.
The best reading is therefore limited but useful: short liquidations were part of the broader market activity, while the observed four-hour spot slice did not confirm aggressive buying. A stronger claim about what drove the rebound would require matched four-hour data for price, spot order flow, open interest measured in ETH or contracts, and actual liquidations across comparable venues.
-- Price
What Would Confirm an Ethereum (ETH) Rebound From $1,800?
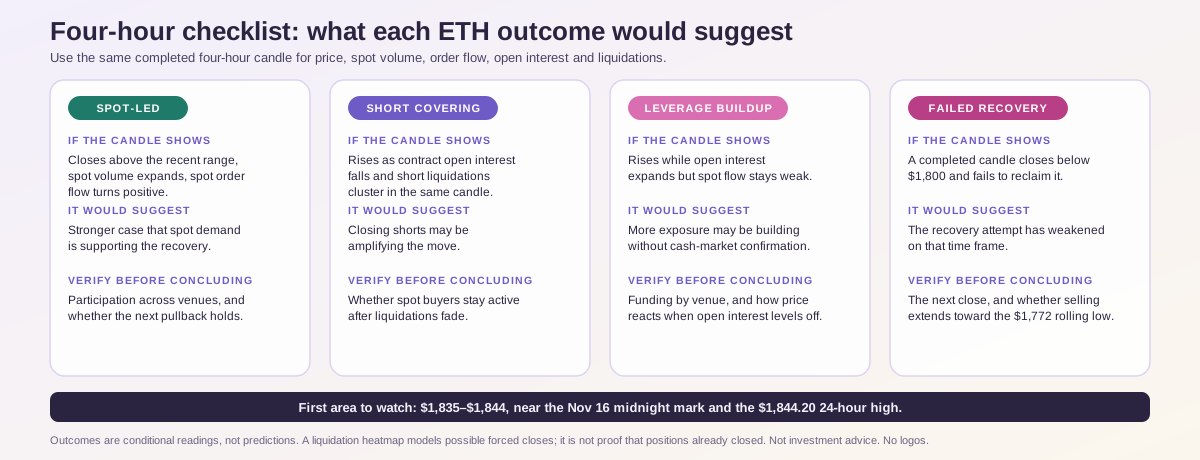
The first area to watch in this snapshot is $1,835–$1,844. The lower end sits near the November 16 midnight mark, and the upper end is near CoinGlass’s $1,844.20 rolling 24-hour high. These figures describe recent trading. They are reference points for testing a recovery, not guaranteed resistance or forecasts.
A price move through the area should be checked against the same completed four-hour candle. Compare spot volume with the preceding completed candles on the same venues, then check whether aggressive spot buys exceeded sells. If possible, look at more than one spot market so a single venue’s order imbalance does not determine the whole conclusion. Positive order flow is more persuasive when spot volume also expands and the next pullback holds above the area the price just reclaimed.
| Four-hour outcome | What it would suggest | What to verify before drawing a conclusion |
|---|---|---|
| ETH closes above the recent range, spot volume expands, and spot order flow turns positive | A stronger case that spot demand is supporting the recovery | Check participation across venues and whether the next pullback holds. |
| ETH rises as contract-denominated open interest falls and short liquidations cluster in the same candle | Closing short positions may be amplifying the move | Check whether spot buyers remain active after liquidations fade. |
| ETH rises while open interest expands, but spot flow remains weak | More exposure may be building without broad cash-market confirmation | Compare funding by venue and watch how price responds when open interest levels off. |
| A completed candle closes below $1,800 and fails to reclaim it | The immediate recovery attempt has weakened on that time frame | Check the next close and whether selling extends toward the prior $1,772 rolling low. |
One example makes the distinction clearer. Suppose ETH crosses $1,844 while contract-denominated open interest drops and short liquidations spike. That is consistent with some short positions being closed. If ETH then holds the area and the next four-hour window shows firmer spot volume with positive taker flow, the recovery case improves after the initial burst. If price instead fades as liquidations subside and spot flow stays negative, there is less evidence that the move can sustain itself.
Check whether a liquidation figure is recorded or estimated. A liquidation heatmap models where leveraged positions could be forced to close. It does not show that those positions already closed, or that price must reach the modeled level. For an explanation of a completed move, actual reported liquidations from the relevant candle are more useful than a modeled cluster ahead of the market.
Did Ethereum (ETH) ETF Inflows Support the Rebound?
Farside Investors’ ETF flow table recorded a $2.3 million net inflow into tracked U.S. spot Ethereum ETFs on Friday, November 13. The total came from $11.6 million into Fidelity’s FETH and $9.3 million out of Grayscale’s ETH; the other tracked funds recorded zero net flow that session. The positive headline masks two funds moving in opposite directions.
| U.S. ETF trading date | Net flow |
|---|---|
| November 9 | −$184.6M |
| November 10 | −$1.3M |
| November 11 | −$144.8M |
| November 12 | −$70.5M |
| November 13 | +$2.3M |
| November 9–13 total | −$398.9M |
Friday’s figure marked an improvement after four negative sessions that week. It did not reverse the weekly outflow. It also did not provide a timestamped explanation for a weekend or early Monday ETH bounce. Crypto spot and derivatives markets continue trading while U.S. ETF shares are out of their regular session. Farside’s rows are reported at the fund-session level, not as a minute-by-minute record of ETH trades.
A stronger ETF signal would be several subsequent sessions of net inflows, ideally across more than one issuer. Even then, compare that trend with the underlying spot market rather than replacing one with the other. ETF flows show demand through a particular investment channel. Spot order flow shows which side crossed the spread during a specific market window. A positive Friday ETF row and weak Monday spot order flow can both be true.
How to Monitor or Trade Ethereum (ETH) on WEEX
The WEEX ETH/USDT perpetual futures market provides exposure to ETH’s price through a contract. Use the same four-hour candle boundaries when comparing its chart with an external source, and verify whether each chart shows a spot price, perpetual last trade, or mark price. Before placing an order, check the bid and ask, available depth, mark price, funding schedule, and applicable fees. Review margin mode, position size, and estimated liquidation level separately.
If the objective is to acquire ETH itself, use the WEEX ETH/USDT spot market. The WEEX Ethereum price page is a reference for tracking the asset; the market’s order book is the better place to see potential execution prices. Near a widely watched level such as $1,800, a price alert or brief last trade may appear without enough depth to fill an order at that price.
Is There a WEEX Ethereum (ETH) Trading Promotion?
No ETH-specific fee discount was verified for this article. The broader WEEX Shopping Fest Lucky Eggs event was scheduled through November 25, 2026, UTC+8, with tasks tied to eligible activity. To participate, sign in on the event page, check the qualifying markets and task requirements, and verify whether your ETH/USDT activity counts. Campaign rewards, order fees, and futures funding are separate.
WEEX Editorial View
ETH had bounced from the weekend lows, but the quality of the recovery was still unconfirmed. The four-hour spot imbalance remained negative on the observed venue, and the broader liquidation data showed that forced short exits were part of the market backdrop. Friday’s ETF inflow was modest next to the week’s outflows and came from a different trading session.
The next update should prioritize one clean comparison: a completed ETH candle around $1,835–$1,844, spot turnover and direction for that same candle, and the change in open interest and liquidations over the same interval. If spot buying strengthens and holds after the liquidation burst, there is a better case for a recovery. If price rises briefly and spot sellers still have the upper hand, the move is better described as a bounce.
FAQ
1. What Was the Ethereum Price on November 16, 2026?
CoinGlass showed $1,809 at 07:15 UTC, up 0.96% over 24 hours and down 15.13% over seven days. This was a timestamped intraday quote.
2. Did Ethereum (ETH) Hold $1,800?
An early November 16 UTC daily candle showed a low near $1,803, but the wider rolling 24-hour range included $1,772. Always specify the window when describing whether ETH held a level.
3. Was the ETH Bounce a Short Squeeze?
The broader 24-hour snapshot showed more short than long liquidations, so forced short exits may have contributed. The available data did not establish a short squeeze as the dominant driver of the specific four-hour move.
4. Did U.S. Spot Ethereum ETFs Record Inflows?
Yes, on Friday, November 13, tracked funds recorded a $2.3 million net inflow. The November 9–13 week still recorded $398.9 million of net outflows.
5. What Would Confirm a Stronger Ethereum (ETH) Rebound?
Look for a completed close above the recent $1,835–$1,844 area, firmer spot volume and positive spot order flow in the same window, and a follow-up session that holds the move after liquidation activity eases.
This content is provided for general informational purposes only and doesn't constitute financial, investment, legal, or tax advice. Any events, rewards, online promotions, or related information mentioned herein should not be considered a recommendation, solicitation, or invitation to purchase, sell, trade, or otherwise deal in any crypto assets. Crypto assets are highly volatile and may result in loss. The availability of WEEX services, products, and related events may vary by region. You are responsible for ensuring that your participation is in accordance with applicable local laws and regulations.
You may also like

Matt Hougan has a positive outlook on Bitcoin and altcoins

Win an iPhone 18 Pro Max on WEEX? 201 Lucky Eggs Explained

Tesla Autopilot Team Veterans Found Simulation Startup Valued at $1 Billion

CoW Swap Launches on Solana, Supporting USDC and Wrapped SOL Exchange

CoW Swap Launches Alpha Version, Supporting USDC and wSOL Exchange

VICE 6 Crypto: Is VICE 6 (VTC) Linked to GTA 6? How to Verify the Token
Is VICE 6 crypto linked to GTA 6? Compare two Solana tokens using VTC, verify their mint and pool addresses, and see what Rockstar has confirmed.
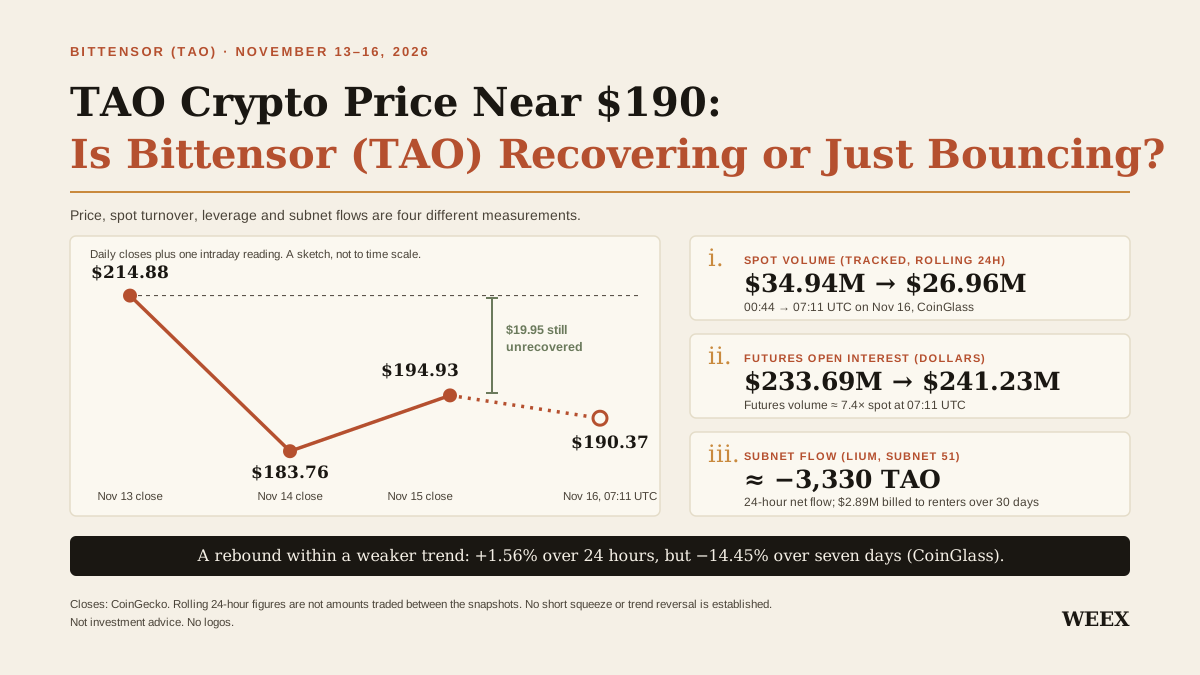
TAO Crypto Price Near $190: Is Bittensor (TAO) Recovering or Just Bouncing?
TAO bounced near $190. Compare spot volume, futures positioning, and Bittensor subnet flows to see what would confirm a more durable recovery.
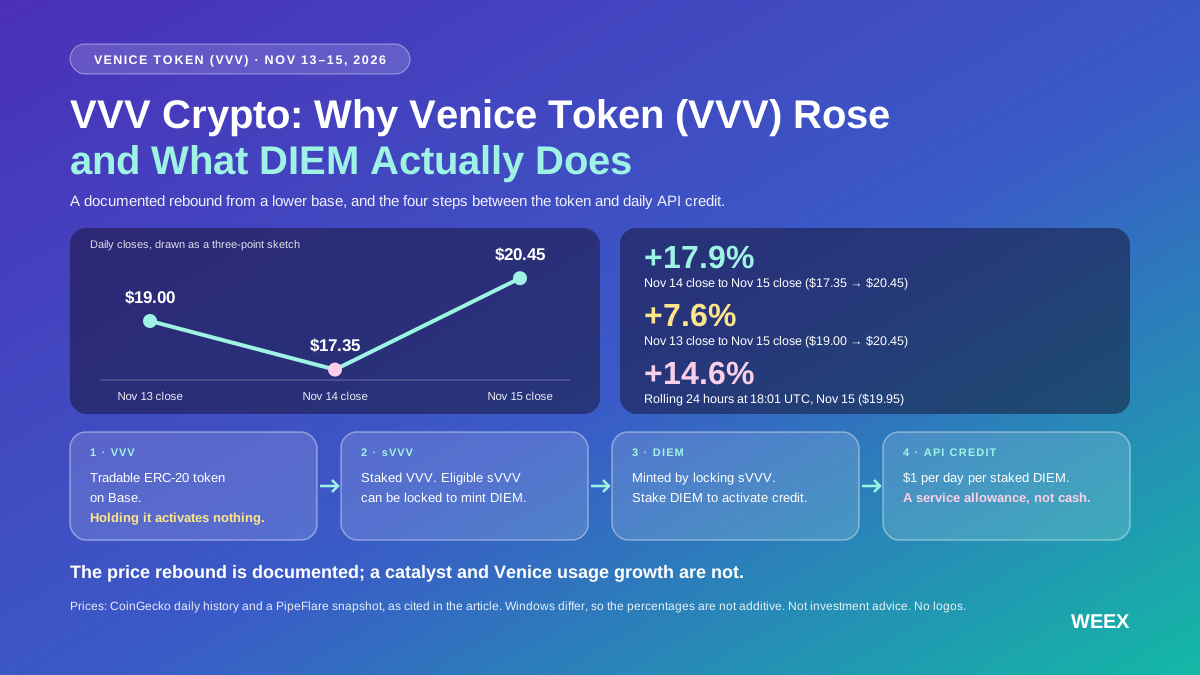
VVV Crypto: What Is Venice Token, Why Venice Token (VVV) Rose and What DIEM Actually Does
Venice Token rose about 14.6% in one November 15 snapshot. Learn what the data shows, how VVV staking works, and what DIEM’s daily API credit buys.
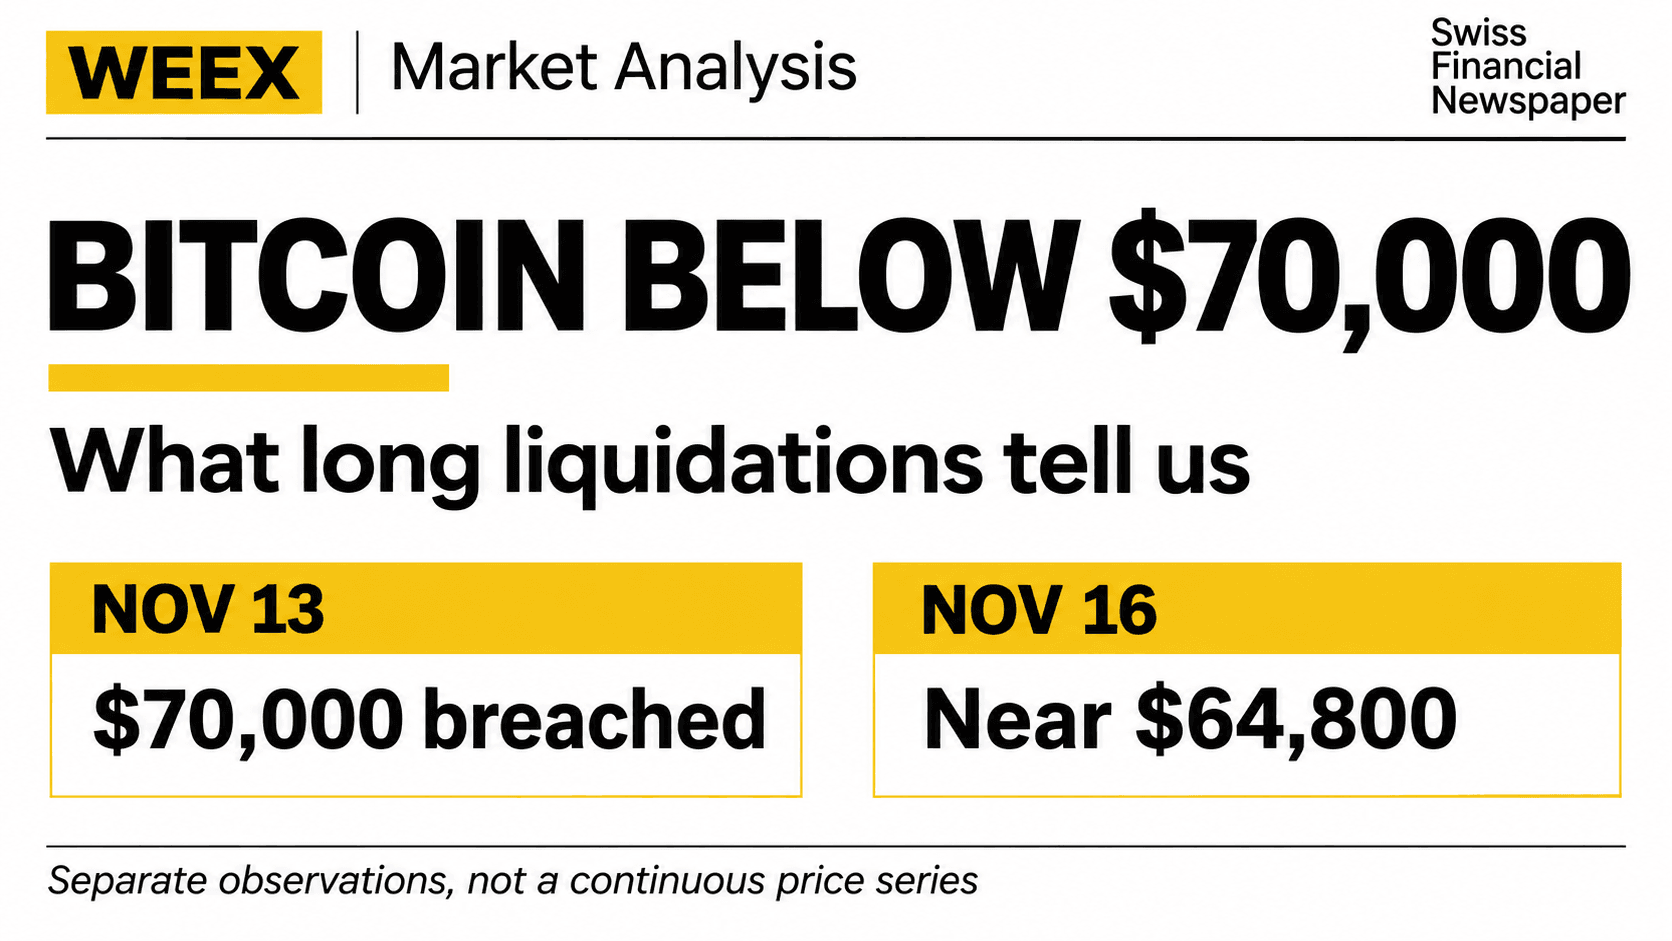
Why Did Bitcoin (BTC) Drop Below $70,000? What Long Liquidations Tell Us
See why Bitcoin fell below $70,000 on November 13, how long liquidations amplified the decline, and what to watch before calling a rebound. If you already plan to trade, you can check whether your activity qualifies for the WEEX Lucky Eggs event, scheduled to run through November 25, 2026 (UTC+8).

WEEX Lucky Eggs: How to Earn Daily Egg Cracks and Win Every Time
Learn how to earn daily WEEX Lucky Eggs from qualifying futures trading volume, check your progress, and understand what “Win Every Time” means.

Meta’s Internal Prediction App Uses Points, Not Cash — and That Distinction Matters

US Signs Silicon Peace Agreement with Eight Nations

Three Questions Every Investor Should Ask About Any Management Team

NuScale Stock Has Lost More Than Half Its Value in 2026, Its Worst Year Since 2023. Here's What Happened the Year After That One.

From 'Patching' to 'Eliminating Entire Classes of Bugs': How to Build Internet Resilience?

5 Dividend Stocks With High Yields That Are Safer Than You Might Think

MiCA gave crypto a passport, but customers still face borders
Regeneron Has $16 Billion in Net Cash and Trades Near 20 Times Earnings. Is It the Cheapest Big Biotech?

Unocoin halts all services after hackers bypass BitGo freeze

Can the Anthropic IPO Save the AI Rally?

Hyperliquid Q3 Revenue Reaches $190.9 Million, Kraken Parent Company Sees 12% Decline in Earnings

Guoyin Financial Leasing Plans to Purchase Computer Equipment for 981 Million Yuan
‘Roadmap is Complete,' Cardano Founder Charles Hoskinson Says

In Anthropic's Doomsday Narrative, There Is No Room for Jensen Huang

What Investment Signals Are Released as the 'Big Three' of AI New Cloud Submit Their Reports?

RWA Weekly: NYSE to Use Avalanche for Settling Tokenized Stocks; Goldman Sachs, Citigroup Commit Approximately $270 Million to Joint Stablecoin Project

BNY Mellon Adds to Invesco Galaxy Bitcoin ETF: What Changes with the Custody Filing?

Ethereum Foundation Launches Universal Ethereum Signer App

CoreWeave Says Its AI Demand Is 10 Times Its Capacity Through 2027. I Think Micron Stock Is Still Worth Buying.

MultiBank Group and Universal Sign Agreement to Develop USDU Settlement Capabilities for Institutional Clients
Matt Hougan has a positive outlook on Bitcoin and altcoins
Win an iPhone 18 Pro Max on WEEX? 201 Lucky Eggs Explained
Tesla Autopilot Team Veterans Found Simulation Startup Valued at $1 Billion
CoW Swap Launches on Solana, Supporting USDC and Wrapped SOL Exchange
CoW Swap Launches Alpha Version, Supporting USDC and wSOL Exchange
VICE 6 Crypto: Is VICE 6 (VTC) Linked to GTA 6? How to Verify the Token
Is VICE 6 crypto linked to GTA 6? Compare two Solana tokens using VTC, verify their mint and pool addresses, and see what Rockstar has confirmed.
Latest articles


Latest coin listings on WEEX


