
Why Did Bitcoin (BTC) Drop Below $70,000? What Long Liquidations Tell Us

 Prefer us on Google



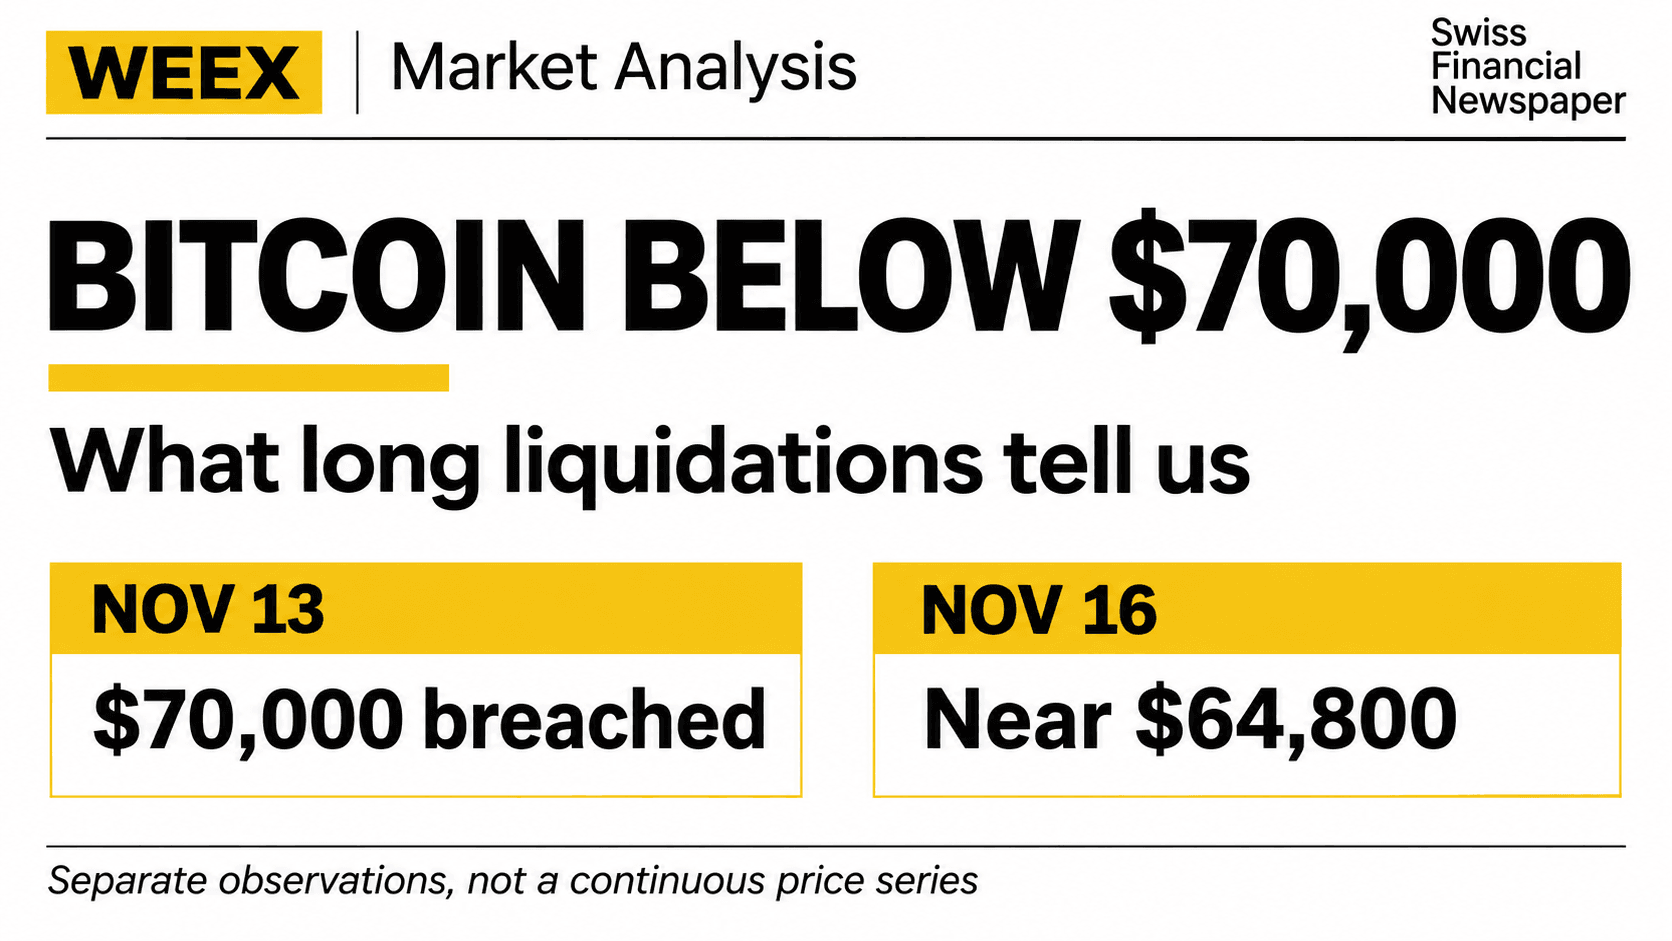
Our view: the most useful number in this sell-off is not the headline liquidation total. It is the share that came from longs, read alongside what the price did afterward. The imbalance tells us which positions were under pressure. The fact that Bitcoin remained well below $70,000 on Monday tells us why a leverage washout alone is not a convincing recovery signal.
Quick Answer
- Bitcoin broke below $70,000 on November 13, 2026, as a stronger U.S. dollar, expectations of tighter monetary policy, and weakness in technology stocks weighed on risk appetite. By early November 16, Reuters reported Bitcoin at $64,796.40.
- The Block reported $1.47 billion in market-wide crypto liquidations over a rolling 24-hour window on November 13, including $1.31 billion in longs. That is about 89% of the reported total.
- The liquidation data helps explain why the decline accelerated. It does not identify who sold first or show that Bitcoin has reached a bottom.
What Put Bitcoin Under Pressure Before the Liquidations?
Bitcoin’s break below $70,000 came during a broader pullback in risk assets. CoinDesk reported that the U.S. Dollar Index had risen above 103 as markets priced in the possibility of a December Federal Reserve rate increase. The Wall Street Journal also pointed to higher yields and weakness in technology stocks as part of the backdrop. Those developments offer plausible reasons for investors to reduce exposure before any individual futures position was forced closed. They do not establish a single cause for the first sell order.
Spot Bitcoin ETF flows offered another clue. CoinDesk, citing Farside Investors, reported roughly $1.88 billion in net outflows from U.S. spot Bitcoin ETFs from the start of November through its November 13 report. That figure covers a different period from the 24-hour liquidation total, and the two should not be added together. The ETF figure tracks net fund flows; the liquidation figure tracks reported forced closures in derivatives markets.
The distinction matters because liquidations can slow down even while demand remains weak. If investors are still reducing exposure, fewer forced closures may make the market less disorderly without making it stronger.
How Did Long Liquidations Amplify the Sell-Off?
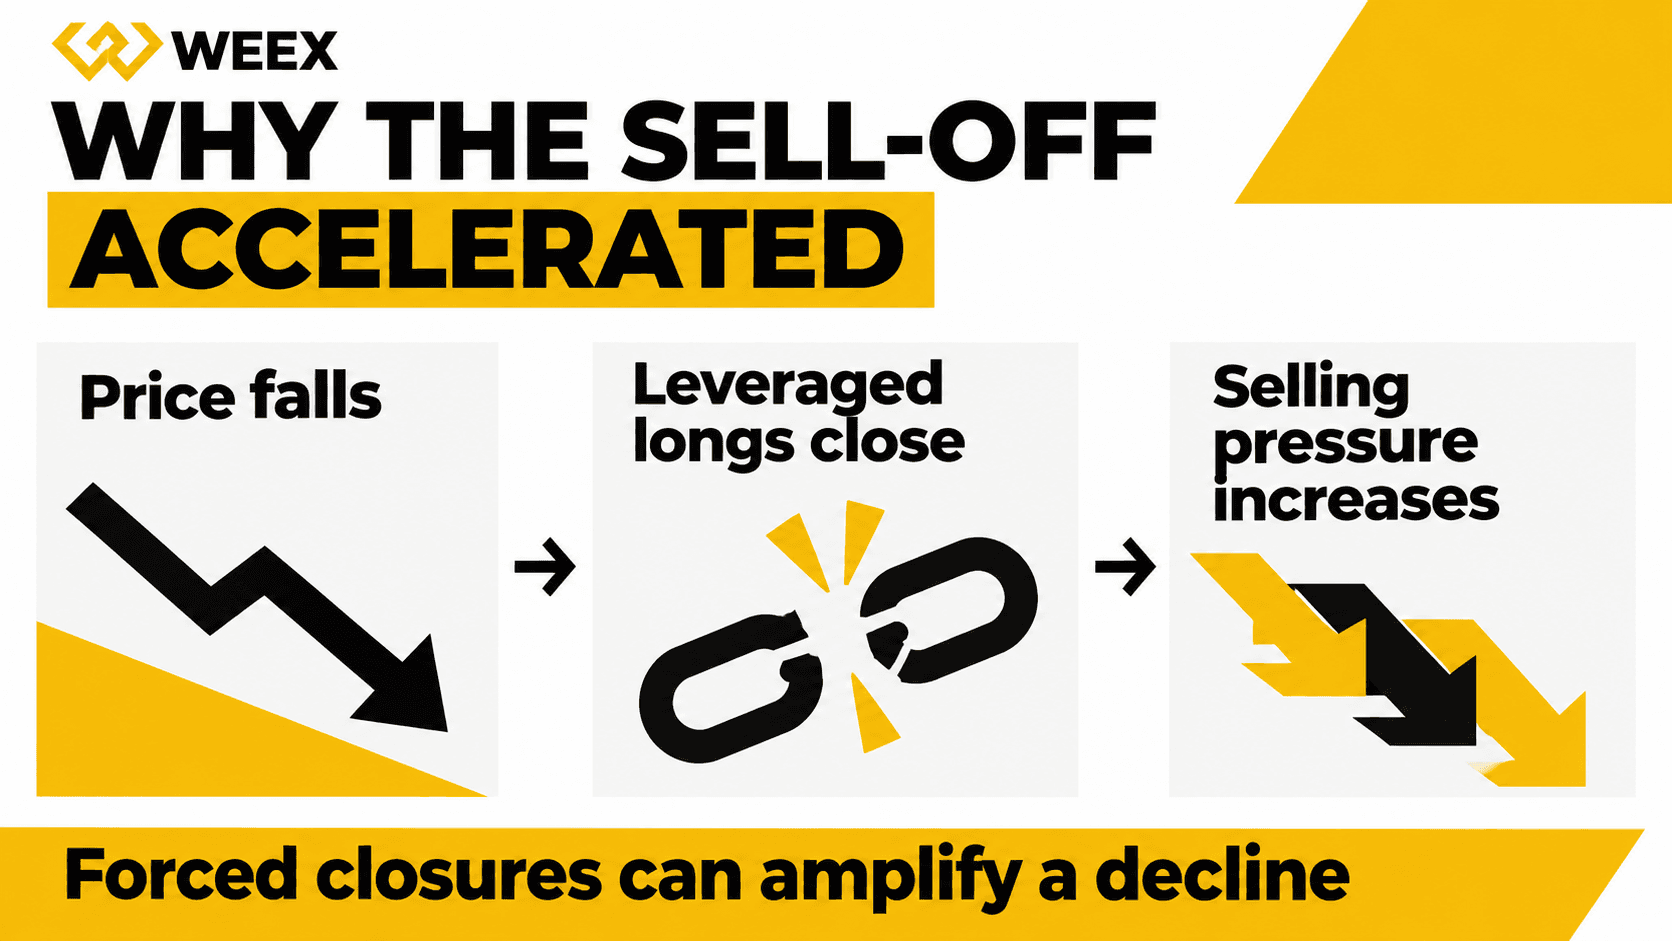
A leveraged long is a position that benefits when the price rises but can be forcibly reduced or closed if the margin supporting it falls below the required level. If prices fall enough to put many longs under pressure at once, forced closures can add sell-side pressure. If buyers cannot absorb that flow at nearby prices, the market can move lower and put another group of leveraged positions under pressure. That feedback loop is what traders call a liquidation cascade.
The November 13 figures show which side was squeezed. In the snapshot cited by The Block, about $1.31 billion of $1.47 billion in reported crypto liquidations came from longs. That is approximately 89%, leaving about 11% on the other side based on the rounded totals. These are market-wide crypto figures, not Bitcoin-only liquidations, and they are not a measure of how much Bitcoin was sold in the spot market.
| Observation | What It Supports | What It Does Not Establish |
|---|---|---|
| Bitcoin broke below $70,000 on November 13 | The decline passed a widely watched price level. | That $70,000 was a common liquidation price for all traders. |
| About 89% of reported crypto liquidations were longs in one 24-hour snapshot | Forced closures were heavily concentrated on the bullish side. | That forced selling started the decline or that the total was Bitcoin-only. |
| Bitcoin was near $64,800 early on November 16 | Friday’s break was followed by further weakness. | That the same liquidation wave was still driving prices on Monday. |
Sources: The Block’s November 13 market report and Reuters’ November 16 market update.
-- Price
Why Did the Reported Liquidation Totals Differ?
The Block reported $1.47 billion in rolling 24-hour crypto liquidations early on November 13. CoinDesk later reported that liquidations had topped $1.6 billion. Those figures are not necessarily contradictory: a rolling window moves with the observation time. As new closures enter the window, older ones fall out.
Before comparing two headlines, check three things: the observation window, whether the number covers Bitcoin or the broader crypto market, and whether it includes both sides or just longs. For example, The Wall Street Journal’s November 16 report cited about $106 million in Bitcoin positions liquidated over the prior 24 hours. Comparing that directly with Friday’s $1.47 billion market-wide total would imply a change in liquidation activity that those two figures cannot measure.
The same caution applies to a liquidation heatmap. A heatmap estimates where positions may be vulnerable if prices reach certain levels. A historical liquidation report describes closures already reported. A bright band on a heatmap is not evidence that those positions have closed or that the market must move toward that price.
What Would Make a Bitcoin Rebound More Convincing?
First, distinguish a price bounce from evidence of renewed demand. A bounce can happen because urgent selling pauses or short sellers close positions. Neither tells you much about whether buyers will keep stepping in once that pressure passes.
A more useful check is to read spot price, futures open interest, and ETF flows together. Open interest measures outstanding derivatives positions; by itself, it does not tell you whether traders are net bullish or bearish. If price rebounds while open interest falls, position closures may be part of the move, but the combination cannot identify who drove the rebound. If price stabilizes while ETF flows improve over several sessions, that would offer a separate sign that one source of selling pressure may be easing. It would still not prove a bottom. The Wall Street Journal highlighted both ETF flows and U.S. yields as factors to watch after the weekend decline.
There is nothing mechanical about $70,000. It is useful because it marks the break this article examines. A brief move back above it would tell us less than whether Bitcoin can hold that area through subsequent sessions and how the market behaves when it is tested again.

Trade on WEEX: Check the Contract and Lucky Eggs Task Separately
If you are following perpetual futures, the WEEX BTC/USDT Perpetual Futures page is the starting point for reviewing the contract. Before submitting an order, check the mark price, your margin mode, and the position’s estimated liquidation price. The distance between the mark price and your estimated liquidation level is more useful for understanding your position than a market-wide liquidation headline.
If you already plan to trade, you can check whether your activity qualifies for the WEEX Lucky Eggs event, scheduled to run through November 25, 2026 (UTC+8). The first daily task milestone is 1,000 USDT in qualifying futures trading volume, not a 1,000 USDT deposit. An eligible egg opening yields a reward, but the type and value can vary. Check the event page for applicable eligibility and task progress; the reward is separate from trading costs and losses.
WEEX Editorial View: Forced Selling Can Fade Before Demand Returns
The November 13 liquidation imbalance helps explain the speed of the sell-off, not its entire cause. Bitcoin’s subsequent move below $65,000 is the clearest reason not to call the Friday washout a turning point. We would put more weight on whether spot prices stabilize across sessions and whether ETF outflows ease than on a single large liquidation print. For anyone trading futures, that same distinction matters at the account level: understand the liquidation risk of the position first, and treat campaign rewards separately.
FAQ
1. Why Did Bitcoin Drop Below $70,000?
The November 13 decline came amid a stronger dollar, expectations of tighter monetary policy, and weaker risk appetite. Long liquidations likely amplified the move, but the available data does not isolate one initial trigger.
2. Was the $1.47 Billion Liquidation Figure for Bitcoin Alone?
No. It was a rolling 24-hour total for reported crypto liquidations across assets. About $1.31 billion of that total came from long positions.
3. Does a Wave of Long Liquidations Mean Bitcoin Has Bottomed?
No. Forced selling can ease while ordinary selling continues or demand remains weak. A liquidation total describes what happened in a given window; it is not a price floor.
4. Does the WEEX Lucky Eggs Daily Task Require a 1,000 USDT Deposit?
No. The first daily milestone is 1,000 USDT in qualifying futures trading volume. Review the event rules to see which activity counts.
Sources
- The Block: Bitcoin Tumbles Below $69,000 — November 13, 2026; market-wide liquidation snapshot attributed to CoinGlass.
- CoinDesk: Bitcoin Hits a 12-Week Low as the Dollar Rallies — November 13, 2026; dollar, rates, ETF flows, and a later liquidation snapshot.
- Reuters: Dollar Extends Gains — November 16, 2026; early-session Bitcoin price snapshot.
- The Wall Street Journal: Crypto Off to Downbeat Start This Week After Selloff — November 16, 2026; weekend follow-through and Bitcoin-specific liquidations.
This content is provided for general informational purposes only and doesn't constitute financial, investment, legal, or tax advice. Any events, rewards, online promotions, or related information mentioned herein should not be considered a recommendation, solicitation, or invitation to purchase, sell, trade, or otherwise deal in any crypto assets. Crypto assets are highly volatile and may result in loss. The availability of WEEX services, products, and related events may vary by region. You are responsible for ensuring that your participation is in accordance with applicable local laws and regulations.
You may also like

Matt Hougan has a positive outlook on Bitcoin and altcoins

Win an iPhone 18 Pro Max on WEEX? 201 Lucky Eggs Explained

Tesla Autopilot Team Veterans Found Simulation Startup Valued at $1 Billion

CoW Swap Launches on Solana, Supporting USDC and Wrapped SOL Exchange

CoW Swap Launches Alpha Version, Supporting USDC and wSOL Exchange

VICE 6 Crypto: Is VICE 6 (VTC) Linked to GTA 6? How to Verify the Token
Is VICE 6 crypto linked to GTA 6? Compare two Solana tokens using VTC, verify their mint and pool addresses, and see what Rockstar has confirmed.
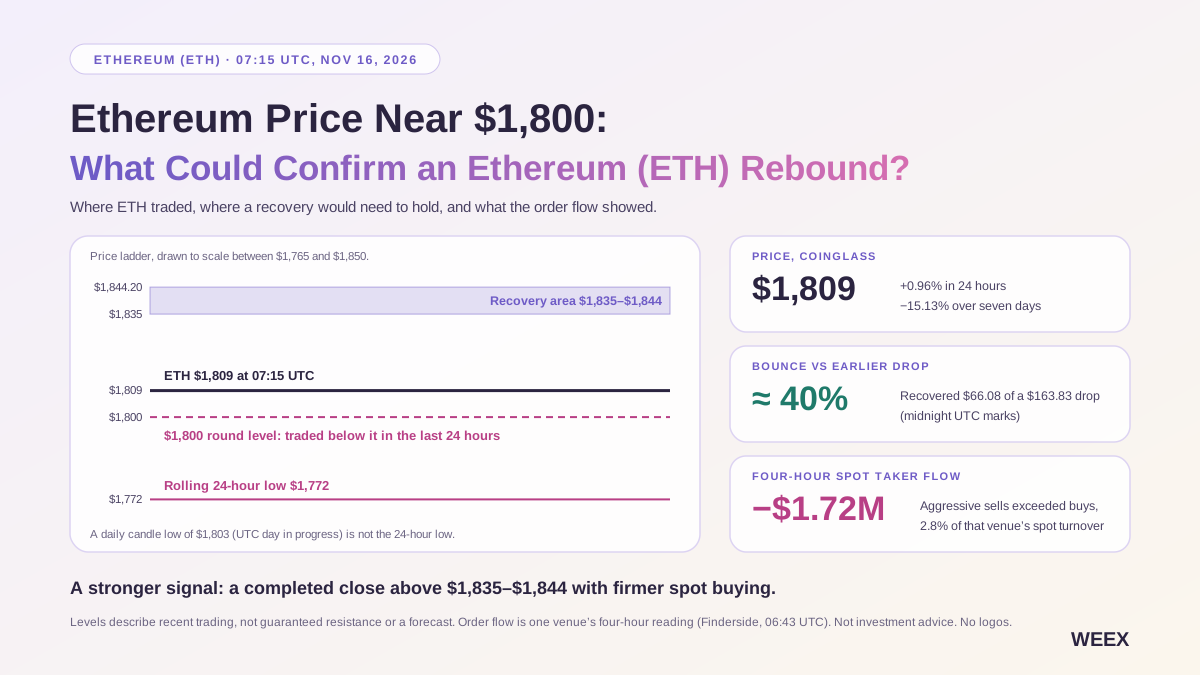
Ethereum Price Near $1,800: What Could Confirm an Ethereum (ETH) Rebound?
Ethereum traded near $1,800 on November 16. See what four-hour spot order flow, futures positioning, and Friday’s ETF flows say about an ETH rebound.
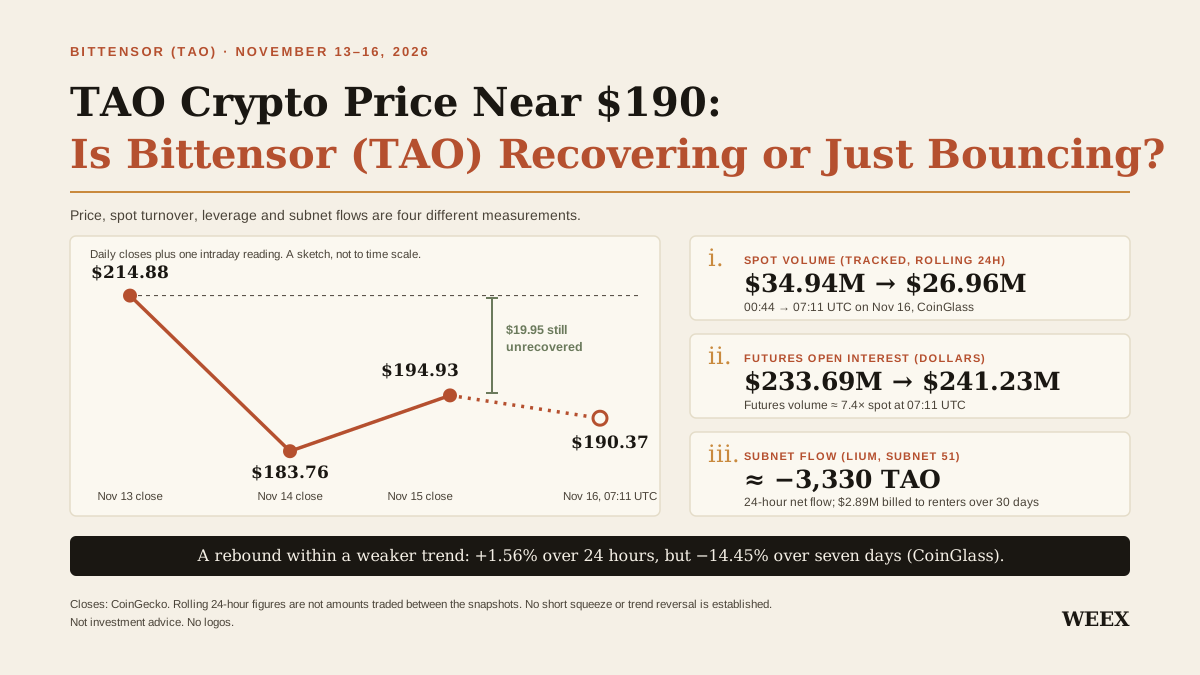
TAO Crypto Price Near $190: Is Bittensor (TAO) Recovering or Just Bouncing?
TAO bounced near $190. Compare spot volume, futures positioning, and Bittensor subnet flows to see what would confirm a more durable recovery.
VVV Crypto: What Is Venice Token, Why Venice Token (VVV) Rose and What DIEM Actually Does
Venice Token rose about 14.6% in one November 15 snapshot. Learn what the data shows, how VVV staking works, and what DIEM’s daily API credit buys.

WEEX Lucky Eggs: How to Earn Daily Egg Cracks and Win Every Time
Learn how to earn daily WEEX Lucky Eggs from qualifying futures trading volume, check your progress, and understand what “Win Every Time” means.

Meta’s Internal Prediction App Uses Points, Not Cash — and That Distinction Matters

US Signs Silicon Peace Agreement with Eight Nations

Three Questions Every Investor Should Ask About Any Management Team

NuScale Stock Has Lost More Than Half Its Value in 2026, Its Worst Year Since 2023. Here's What Happened the Year After That One.

From 'Patching' to 'Eliminating Entire Classes of Bugs': How to Build Internet Resilience?

5 Dividend Stocks With High Yields That Are Safer Than You Might Think

MiCA gave crypto a passport, but customers still face borders
Regeneron Has $16 Billion in Net Cash and Trades Near 20 Times Earnings. Is It the Cheapest Big Biotech?

Unocoin halts all services after hackers bypass BitGo freeze

Can the Anthropic IPO Save the AI Rally?

Hyperliquid Q3 Revenue Reaches $190.9 Million, Kraken Parent Company Sees 12% Decline in Earnings

Guoyin Financial Leasing Plans to Purchase Computer Equipment for 981 Million Yuan
‘Roadmap is Complete,' Cardano Founder Charles Hoskinson Says

In Anthropic's Doomsday Narrative, There Is No Room for Jensen Huang

What Investment Signals Are Released as the 'Big Three' of AI New Cloud Submit Their Reports?

RWA Weekly: NYSE to Use Avalanche for Settling Tokenized Stocks; Goldman Sachs, Citigroup Commit Approximately $270 Million to Joint Stablecoin Project

BNY Mellon Adds to Invesco Galaxy Bitcoin ETF: What Changes with the Custody Filing?

Ethereum Foundation Launches Universal Ethereum Signer App

CoreWeave Says Its AI Demand Is 10 Times Its Capacity Through 2027. I Think Micron Stock Is Still Worth Buying.

MultiBank Group and Universal Sign Agreement to Develop USDU Settlement Capabilities for Institutional Clients
Matt Hougan has a positive outlook on Bitcoin and altcoins
Win an iPhone 18 Pro Max on WEEX? 201 Lucky Eggs Explained
Tesla Autopilot Team Veterans Found Simulation Startup Valued at $1 Billion
CoW Swap Launches on Solana, Supporting USDC and Wrapped SOL Exchange
CoW Swap Launches Alpha Version, Supporting USDC and wSOL Exchange
VICE 6 Crypto: Is VICE 6 (VTC) Linked to GTA 6? How to Verify the Token
Is VICE 6 crypto linked to GTA 6? Compare two Solana tokens using VTC, verify their mint and pool addresses, and see what Rockstar has confirmed.
Latest articles


Latest coin listings on WEEX


