SOL Price Outlook: Solana Bulls Test $71 Resistance After Rebound


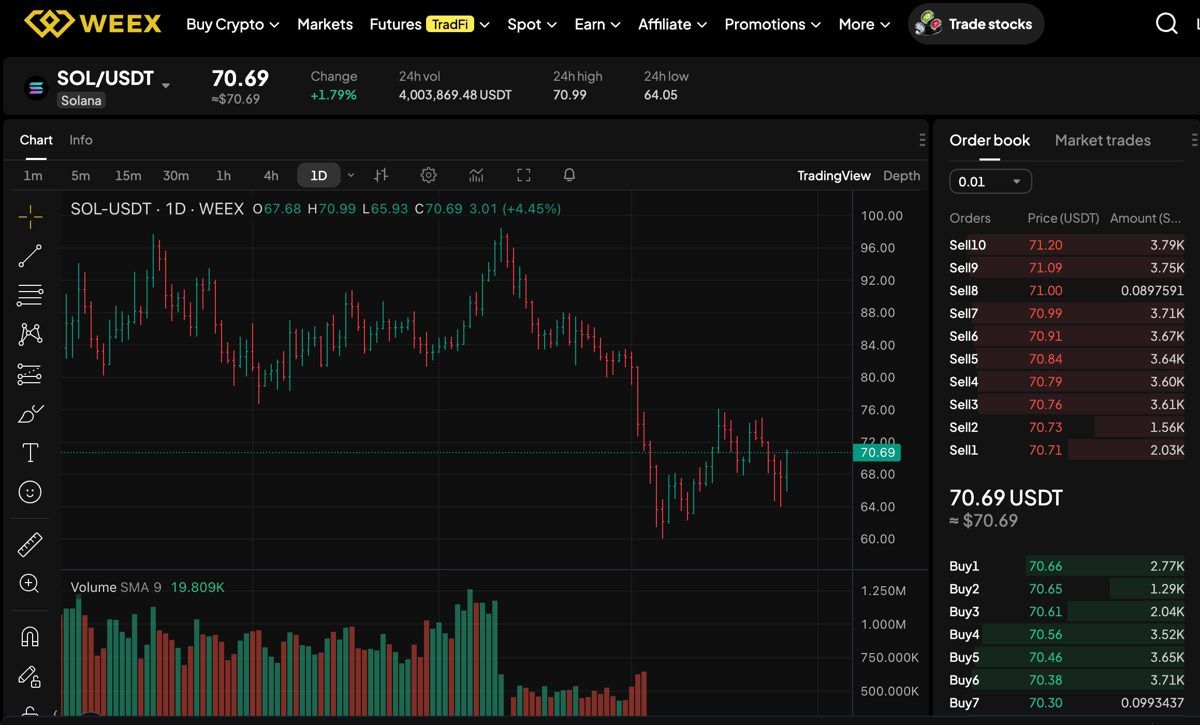
Solana is trading near $70.69 on the SOL/USDT spot market after a 1.79% 24-hour gain, with the latest WEEX chart showing a 24-hour high near $70.99, a low near $64.05, and volume around 4,003,869.48 USDT. The short-term setup has improved, but SOL is now testing resistance near $71. Bulls need a clean move above $71 to confirm continuation, while support near $64 to $66 remains the key area to defend if momentum cools.
WEEX users can monitor SOL spot price action before trading, while new users can register on WEEX to check available pairs, liquidity, fees, and market risk. The 7-day change is not visible in the screenshot, so traders should confirm the weekly trend against live market data before entering.
Bullet Summary
- Current support: SOL needs to hold the $64 to $66 area to keep the rebound structure alive.
- Current resistance: The $70.99 to $71 area is the first major level bulls need to break.
- Moving average status: The 1D chart is trying to recover after a selloff, so short-term moving averages should be checked for confirmation.
- Pattern status: SOL has bounced from the lower range but still needs a breakout above resistance to avoid another rejection.
- Next key level: A break above $71 could open a move toward $75 to $76, while losing $64 may expose $60 to $62.
What Is Driving Solana Price Today?
Solana price today is being driven by a rebound from the lower part of the recent range. The WEEX spot chart shows SOL rising from a 24-hour low near $64.05 toward the $70.99 high, which suggests buyers stepped in after the latest pullback. However, the price is now close to resistance, so the next move depends on whether buyers can sustain momentum above $71.
The key driver is short-term market recovery. SOL has been under pressure on the wider 1D chart, but the latest price action shows a bounce with visible trading activity. Volume around 4,003,869.48 USDT confirms that the spot market is active. Still, a rebound is not the same as a confirmed reversal. Traders need to see follow-through above resistance before treating the move as a stronger recovery.
Solana Price Eyes Recovery
Solana can extend its recovery if price holds above the $64 to $66 support area and breaks through $71. A close above $71 would show that buyers are regaining control after the recent decline and could open the path toward $75 to $76.
The chart shows SOL recovering after a drop toward the low-$60 range. For the rebound to become more convincing, traders should watch whether SOL forms higher lows above $66 and whether green candles continue to attract volume. If the move stalls below $71, the market may stay range-bound rather than turning clearly bullish.
Another Drop?
Another drop becomes more likely if Solana fails to break $71 and loses the $64 support area. In that case, traders may watch $62 and $60 as the next downside liquidity zones. A move below $64 would weaken the rebound and suggest that sellers are still controlling the broader structure.
The bearish case strengthens if SOL repeatedly rejects near $71 and volume fades on each bounce. For spot traders, the key is to avoid chasing resistance without confirmation. A cleaner setup would be either a breakout above $71 or a pullback that holds support and forms a stronger base.
Key Support and Resistance Levels
| Level | Price area | Why it matters |
|---|---|---|
| Immediate support | $64 to $66 | Buyers need to defend this area to keep the rebound alive. |
| Breakdown level | Below $64 | Losing this level may shift momentum bearish and expose lower liquidity. |
| Immediate resistance | $70.99 to $71 | Bulls need to reclaim this area to confirm stronger recovery. |
| Breakout level | Above $71 | A close above this level may support continuation toward $75 to $76. |
Market Data to Watch
| Metric | Current reading | What traders should watch |
|---|---|---|
| Price | $70.69 | Whether SOL can hold near resistance or gets rejected below $71. |
| 24h change | +1.79% | Shows short-term recovery momentum. |
| 24h volume | 4,003,869.48 USDT | Activity is visible, but direction depends on breakout follow-through. |
| 24h high | $70.99 | This area lines up with immediate resistance. |
| 24h low | $64.05 | This area defines the support zone bulls need to protect. |
Technical Indicators
| Indicator | Current signal | What it means |
|---|---|---|
| MACD | Not visible in the screenshot | MACD should be watched for confirmation of whether upside momentum is improving or fading. |
| RSI | Not visible in the screenshot | RSI should be checked to see whether SOL is overbought, neutral, or still recovering from weakness. |
| Major support levels | $66, $64, $60 | These levels define downside risk if current support breaks. |
| Major resistance levels | $71, $75, $76 | These levels define recovery confirmation and upside targets. |
Bullish and Bearish Scenarios
| Scenario | Trigger | Possible outcome |
|---|---|---|
| Bullish case | SOL holds $64 to $66 and breaks above $71 | Momentum may extend toward $75 to $76 if buyers confirm the recovery. |
| Bearish case | SOL loses $64 with rising sell volume | Price may retest $62 or $60 as the next liquidity area. |
| Range-bound case | SOL stays between $64 and $71 | Traders may wait for confirmation before chasing either side. |
What This Means for Traders
For traders, SOL is showing a better short-term tone than the previous selloff, but the breakout is not confirmed yet. The price is near resistance, so buying directly into $71 can be risky unless volume and follow-through improve.
Spot traders should focus on liquidity, slippage, support confirmation, and position sizing. If SOL closes above $71 with strong demand, the recovery setup improves. If it rejects and falls back below $66, the market may return to range-bound or bearish conditions.
How to Trade Solana on WEEX: Step by Step Guide
- Go to the WEEX official website and create your WEEX account.
- Deposit funds by transferring crypto from your wallet, or buy crypto through fiat options or WEEX Quick Buy.
- Go to the spot section and search for the SOL/USDT trading pair.
- Enter the amount of Solana you want to buy, review the order details, and place your spot order.
- Secure your Solana. You can transfer SOL to your own wallet or leave it on WEEX only for active trading.
Bottom Line
Bottom line: Solana currently looks range-bound with a bullish tilt while it holds above the $64 to $66 support area, but a confirmed breakout still requires a clean move above $71. If SOL breaks resistance, $75 to $76 becomes the next upside zone. If it loses $64, bears may regain control and push price toward $60 to $62.
Before you go, you can learn about the WEEX Token (WXT) for ecosystem participation and explore the WEEX welcome bonus if you are comparing trading venues and market access.
FAQ
1. What is Solana price today?
Solana is trading near $70.69 on the SOL/USDT spot market in the WEEX screenshot.
2. Why is SOL moving today?
SOL is moving as traders react to a 1.79% 24-hour gain, support near $64.05, and resistance near $70.99 to $71.
3. Can Solana recover from here?
Solana can recover if it holds above $64 to $66 and breaks above $71 with stronger buying momentum.
4. What is the key support level for SOL?
The key support area is around $64 to $66, close to the visible 24-hour low on the WEEX chart.
5. What is the key resistance level for SOL?
The key resistance area is around $70.99 to $71. A clean break above this zone would improve the bullish recovery case.
6. Is SOL bullish or bearish now?
SOL looks range-bound with a bullish tilt while it holds above $64 to $66, but bulls still need a breakout above $71.
7. Can I trade SOL on WEEX?
Yes. SOL/USDT spot trading is available on WEEX. Users should review liquidity, fees, volatility, and risk controls before trading.
DISCLAIMER: WEEX and affiliates provide digital asset exchange services, including derivatives and margin trading, only where legal and for eligible users. All content is general information, not financial advice. Seek independent advice before trading. Cryptocurrency and contract trading are high risk and may result in total loss. By using WEEX services you accept all related risks and terms. Never invest more than you can afford to lose. See our Terms of Use and Risk Disclosure for details.
You may also like

Can SMR Reach $20 in 2026? NuScale Power Price Prediction
KEY TAKEAWAYS Current price: SMR/USDT is at $10.225 as of publication, based on live market tracking. Required move:…
What Is Vanguard Oil Retirement Fund (VORF)? Legit Crypto Fund or Solana Meme Coin?
What is Vanguard Oil Retirement Fund (VORF) crypto? Discover if VORF is a legit fund or Solana meme coin, current price, market cap, where to trade it, and key risks before you buy.
Can SMH Reach $700 in 2026? VanEck Semiconductor June 2026 Price Forecast
KEY TAKEAWAYS Current price: SMH trades near $631 today, based on aggregated data from major market trackers and…
Can ANSEMSOL Reach $1 in 2026? ANSEM June 2026 Price Forecast
KEY TAKEAWAYS Current price: ANSEM trades around $0.13 today, based on aggregated market dashboards such as CoinMarketCap and…
SMH vs QQQ Prediction 2026–2027: Which Is the Better Investment?
This SMH vs QQQ prediction for 2026–2027 compares exposure, volatility, earnings sensitivity, and AI-driven catalysts to help you…
Should I Buy Gold Now After the Crash? What the Market Is Really Signaling
Gold’s sharp sell-off looks scary, but the mechanics behind it are mostly about positioning, liquidity, and shifting rate…
AMZN Stock Prediction 2026-2027: Is Amazon Still a Strong Buy?
AMZN is entering 2026–2027 with a familiar growth engine (AWS), a rising AI narrative, and lingering questions about…
VanEck Semiconductor (SMH) Price Prediction, Forecast for June 2026: Can AI Momentum Keep It Above $630?
VanEck Semiconductor ETF (SMH) remains a bellwether for AI infrastructure as chip demand drives markets. As of today,…
$ANSEM Price Prediction (June 2026) — ANSEMSOL Forecast: Can The Black Bull Hold $0.13 After a 16% 24H Rally?
$ANSEM (The Black Bull) spiked into late June with meme-fueled momentum on Solana. At press time, gmgn.ai aggregated…
Stock Market Today: Dow Holds Above 52,000 as Wall Street Braces for a Jobs-Heavy Week
Stocks open June 30 at record highs after the Dow tops 52,000. Here's what drove Monday's rally and the JOLTS, ADP, and payrolls data that decides this week.
Dow Jones Today: Record 52,000 Close and What Comes Next
The Dow Jones today hit a record above 52,000 after Alphabet's debut. See the drivers, the jobs report risk this week, and what it means for crypto.
MU Stock Price Prediction 2026–2030: Can Micron Hit $3,000?
Can MU stock reach $3,000 by 2030? See the latest Micron price targets, three forecast scenarios, the Anthropic deal, and the risks behind the AI memory rally.
USWR Price Prediction 2026: A Scenario Map for the Water Meme Coin
USWR price prediction for 2026, mapped to liquidity and attention. See United States Water Reserve scenarios, the $1 math, catalysts, and risks.
SpaceX Stock (SPCX): How to Buy and Trade After the Record IPO
SpaceX stock now trades on Nasdaq as SPCX after a record IPO. See the price, the valuation debate, and how to buy or trade SPCX — including crypto-settled routes.
Microsoft Stock and the Italy Probe: What EU Pressure Means for MSFT
Microsoft Stock sits at the center of a new regulatory test in Europe. Italy’s competition authority opened an…
Why ASML Stock Is the Best Picks and Shovels Play on AI
ASML stock sits at the choke point of the AI supply chain. It sells the lithography tools every…
ASML Stock and Korea’s $1.3 Trillion Chip Plan: What It Means for EUV Demand
South Korea just unveiled a decade-long semiconductor strategy worth roughly $1.3 trillion. That scale doesn’t just lift memory…
Is ASML Stock a Buy Before Earnings?
ASML stock has surged into its July 15 earnings date, forcing a classic decision: buy strength now or…
Can SMR Reach $20 in 2026? NuScale Power Price Prediction
KEY TAKEAWAYS Current price: SMR/USDT is at $10.225 as of publication, based on live market tracking. Required move:…
What Is Vanguard Oil Retirement Fund (VORF)? Legit Crypto Fund or Solana Meme Coin?
What is Vanguard Oil Retirement Fund (VORF) crypto? Discover if VORF is a legit fund or Solana meme coin, current price, market cap, where to trade it, and key risks before you buy.
Can SMH Reach $700 in 2026? VanEck Semiconductor June 2026 Price Forecast
KEY TAKEAWAYS Current price: SMH trades near $631 today, based on aggregated data from major market trackers and…
Can ANSEMSOL Reach $1 in 2026? ANSEM June 2026 Price Forecast
KEY TAKEAWAYS Current price: ANSEM trades around $0.13 today, based on aggregated market dashboards such as CoinMarketCap and…
SMH vs QQQ Prediction 2026–2027: Which Is the Better Investment?
This SMH vs QQQ prediction for 2026–2027 compares exposure, volatility, earnings sensitivity, and AI-driven catalysts to help you…
Should I Buy Gold Now After the Crash? What the Market Is Really Signaling
Gold’s sharp sell-off looks scary, but the mechanics behind it are mostly about positioning, liquidity, and shifting rate…