
Bitcoin's $2.7 Billion Short Squeeze: What Triggered the Largest Liquidation Event of August 2026

 Prefer us on Google


BTC snapped back into the spotlight on August 20, 2026, when BTC surged above $70,000 and forced more than $2.7 billion in short liquidations, according to TradingKey. BTC then reached about $71,500, Bloomberg reported, after starting the day near an intraday low of roughly $64,112 cited by Forbes. For beginners, this was not just another sharp BTC rally. It was a textbook short squeeze in a market where derivatives, spot demand, trading volume, and positioning all fed into one another. This article focuses on how the liquidation mechanism worked, why so many bearish positions had built up, why $67,000 mattered so much, and what this event may mean for the next move.
At a Glance
- More than $2.7 billion in BTC short liquidations hit on August 20, 2026, making it the largest single-day liquidation event of the month, according to TradingKey.
- BTC rose about 11% on the day, with 24-hour trading volume reaching roughly $31.6 billion, up 50%, based on TradingKey and CoinGecko data.
- The move from around $64,112 to about $71,500 became self-reinforcing as forced buybacks from short sellers pushed the price even higher.
- $67,000 mattered because it flipped from resistance to support and aligned with CryptoQuant data on the average cost basis of 1- to 3-month holders.
- The squeeze removed many old short positions, but it may also set up fresh bearish bets at higher prices near the recent high.
What a Short Squeeze Actually Is and How It Works in Crypto
A short squeeze starts with traders betting that BTC will fall. In simple terms, a trader opens a short position by borrowing BTC or using a derivative contract that profits if the price drops. If BTC falls, the trader can buy back lower and keep the difference. If BTC rises instead, the trade moves against them.
This is where margin and liquidation come in. Most short positions in crypto use leverage, which means traders put up collateral rather than funding the full size of the position themselves. As BTC rises, losses eat into that collateral. Once the account drops below the exchange’s maintenance margin requirement, the platform closes the position automatically. To close a short, the exchange has to buy BTC back in the market.
That forced buying matters. It does not come from fresh bullish conviction. It comes from risk controls. If enough short positions are liquidated in a tight period, those buy orders push the price higher, which then forces more short sellers out. That chain reaction is the squeeze.
For a beginner-friendly example, suppose a trader shorts BTC at $65,000 using leverage and expects a breakdown below support. If BTC climbs to $67,000, then $68,000, the trader’s margin shrinks. If the account can no longer support the position, the exchange closes it by buying BTC. Multiply that by thousands of similar trades, and the market can accelerate very quickly.
What Built the $2.7 Billion Short Position Before the Squeeze
The best way to understand the August 20 move is to look at the weeks before it. BTC spent much of July and early August moving in a relatively frustrating range around $62,500 to $65,000. Sideways price action often creates confidence on both sides, but it tends to attract short-term bears when support keeps getting tested without a clean breakout higher.
Many traders appeared to be positioning for a break below $62,500. That view was not irrational on its own. After all, BTC had been below $70,000 since June 1, according to Bloomberg, and 2026 had already shown that ETF-related demand did not move in a straight line. Research cited by Ryder shows U.S. spot Bitcoin ETFs had absorbed roughly $58 billion of cumulative net inflows by 2026 and locked up about 6.77% of mined BTC supply, yet CoinDesk also noted that flows became less one-directional during the first half of the year. In other words, the broader BTC market was mature enough to attract institutional money, but still volatile enough to punish crowded positioning.
That mix matters. A market with deep institutional participation can still develop crowded leverage on shorter time frames. Once traders got comfortable fading BTC rallies under resistance, the short base grew. Then the market turned against them all at once.
-- Price
How the Squeeze Cascade Actually Unfolded on August 20
On August 20, BTC did more than drift upward. It broke higher with force. TradingKey reported that BTC gained about 11% on the day, while CoinGecko showed 24-hour trading volume near $31.6 billion, up 50%. That rise in volume is important because squeezes need enough activity to convert forced closing into visible price impact.
The session began from an intraday low around $64,112, according to Forbes. As BTC climbed, early shorts likely faced pressure first. Some covered manually. Others were liquidated. Those forced buy orders helped lift the price into the next zone, where additional short positions became vulnerable. The process repeated itself in layers.
By the time BTC traded above $70,000 for the first time since June 1, the move had clearly become more than a normal breakout. Bloomberg reported a high near $71,500. At that stage, the market was no longer just reacting to bullish headlines or macro relief. It was reacting to its own internal structure. Traders who had leaned too heavily on downside bets were effectively turned into market buyers through liquidation.
This is why liquidation events can look irrational in real time. The price is not rising simply because new buyers are calmly accumulating spot BTC. The price is also rising because the market is force-closing losing bearish trades as fast as the engine can process them.
Why $67,000 Was the Critical Trigger Level
The $67,000 area stood out because it represented more than a round number. TradingKey noted that $67,000 flipped from resistance into support during the move. The event context also points to CryptoQuant data showing this level as the average cost basis for 1- to 3-month holders.
That makes it psychologically and structurally important. When BTC trades below a key holder cost basis, recent buyers are underwater and rallies can face selling pressure. When BTC reclaims that same level, the tone changes. Those same holders move back into profit, which often reduces immediate selling pressure. At the same time, short sellers who used that area as a ceiling suddenly face a failed thesis.
Once BTC pushed through $67,000, it likely triggered the first major wave of short covering and liquidations. That buying then helped establish the level as support rather than resistance. From there, the path toward higher liquidation clusters became easier. The rally from the low near $64,112 to the high near $71,500 was not a straight line in theory, but in practice it behaved like an accelerating chain reaction.
What $2.7 Billion in Liquidations Means in Historical Context
More than $2.7 billion in short liquidations is a very large number by any normal trading standard, and TradingKey identified it as the biggest single-day liquidation event of August 2026. That alone makes it historically notable within the month.
Still, the real lesson is not that a huge liquidation automatically guarantees a lasting bull run. Liquidation events tell you that positioning was badly offside. They do not, by themselves, tell you what happens next. Sometimes a squeeze becomes the start of a broader trend because spot buyers and institutional flows keep supporting the move. Sometimes the market exhausts itself after forced buying fades.
That caution matters even more in 2026 because BTC is now tied more closely to mainstream capital markets than before. Ryder’s research suggests U.S. spot BTC ETFs hold a meaningful share of mined supply, while Yahoo Finance data cited in the same research shows BlackRock’s IBIT alone held about 782,180 BTC as of late March 2026. At the same time, Banque de France warned that roughly 80% of the underlying crypto assets in major crypto ETFs are concentrated with Coinbase custody. So BTC is deeper and more institutional than in earlier cycles, but it is also more systemically important and still highly volatile.
What the Short Squeeze Tells You About the Next Move
After a major squeeze, the old shorts are mostly gone. That changes market structure immediately. One source of forced buying has been spent. The next question becomes whether new buyers step in, or whether fresh short sellers rebuild positions at higher levels.
The area near $71,500 is the obvious place to watch because it marks the recent high reported by Bloomberg. Traders who believe the move was mostly mechanical may try to short there, expecting the rally to cool once liquidations are complete. If enough of those new short positions build up and BTC pushes higher again, the market could see a second squeeze. If BTC fails to hold higher levels, those fresh shorts could become part of the selling pressure that caps the price in the near term.
For beginners, the key takeaway is simple: a short squeeze resets positioning, but it does not settle the trend. The next directional move will depend less on the old liquidations and more on what replaces them. Watch whether BTC can hold reclaimed support zones, especially around $67,000, and whether trading volume remains elevated after the panic buying fades.
FAQ
What is a crypto short liquidation?
It happens when a trader betting against BTC runs out of margin as the price rises, and the exchange automatically closes the position by buying BTC back.
Why did more than $2.7 billion in short positions build up before August 20?
BTC spent weeks ranging around $62,500 to $65,000, which encouraged many traders to bet on a downside break below support.
Why was $67,000 so important in this event?
It flipped from resistance to support and matched a key recent-holder cost basis level highlighted by CryptoQuant data in the event context.
What usually happens after a short squeeze ends?
Old bearish positions are cleared out, but new shorts may open at higher prices. That means the market often enters a fresh battle rather than a one-way move.
How big was this liquidation event historically?
According to TradingKey, it was the largest single-day liquidation event of August 2026 and one of the more significant BTC squeeze episodes of the year.
The August 20 BTC squeeze was a reminder that price moves are often driven as much by market structure as by narrative. When a crowded derivatives trade breaks, forced buying can turn a normal breakout into a rapid repricing event. For traders and investors, that means the most useful question is not just whether BTC is bullish or bearish, but where leverage is concentrated and which levels can force the market to move faster than expected.
This content is provided for general informational purposes only and doesn't constitute financial, investment, legal, or tax advice. Any events, rewards, online promotions, or related information mentioned herein should not be considered a recommendation, solicitation, or invitation to purchase, sell, trade, or otherwise deal in any crypto assets. Crypto assets are highly volatile and may result in loss. The availability of WEEX services, products, and related events may vary by region. You are responsible for ensuring that your participation is in accordance with applicable local laws and regulations.
You may also like

Best Crypto Miner for Beginners: What to Check on Cost, Power, Hashprice and Profit Before You Buy
MU Stock Falls Below $1,000: Is the CXMT Threat Real or Just an Excuse to Take Profits?
Stop Limit Order: How It Works and Why It Can Fail to Fill

Best Crypto Podcasts for Beginners: A 4-Week Listening Plan

Will Bitcoin Break $87,000 This Week? CPI, Fed Speakers and ETF Outflows to Watch

Conflux (CFX) Price Jumps on China's National Blockchain Network Plan: Does the Policy Actually Name CFX?

What Is Plume (PLUME)? Why the RWA Token Stays 93% Below Its High Even After the Layer 2 Rally

Who Is David Ellison? Skydance’s Strategy, Media Consolidation, and the Investment Case
Crypto Funding Rate: Who Pays, What It Costs, What It Signals
PEP Earnings: PepsiCo Beats Q3, Cuts Guidance on North America
BTC Futures Analysis: $80K Held, but Longs Are Still Paying Up
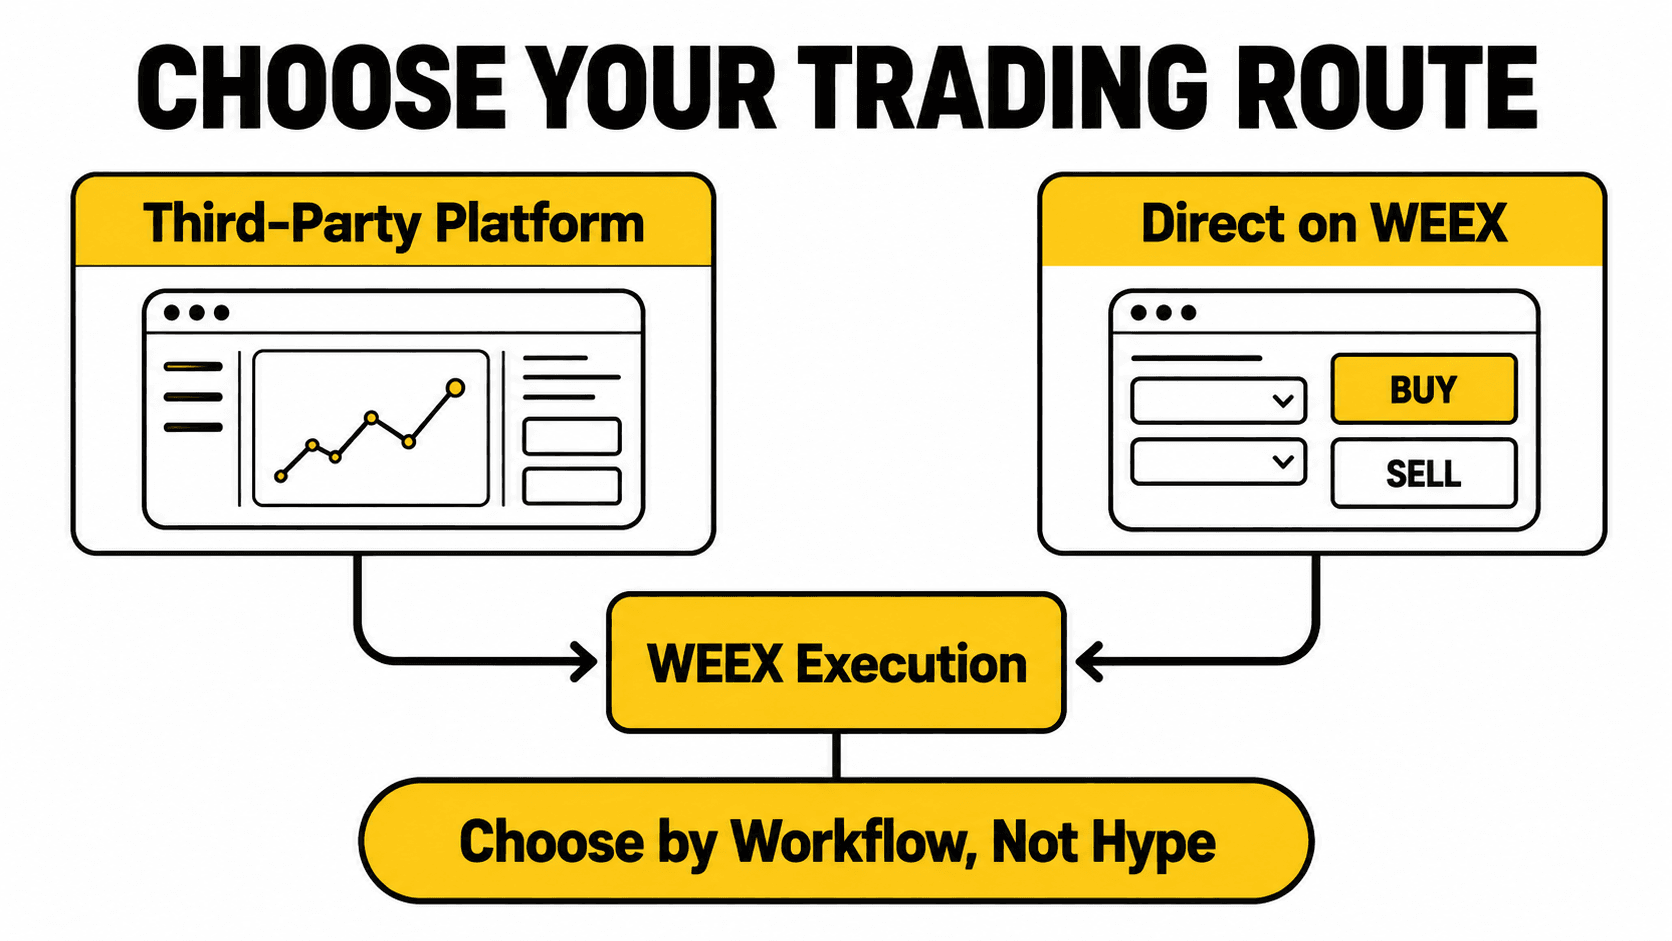
Third-Party Trading Platforms vs Direct WEEX Trading: Fees, Liquidity, Security, and Control
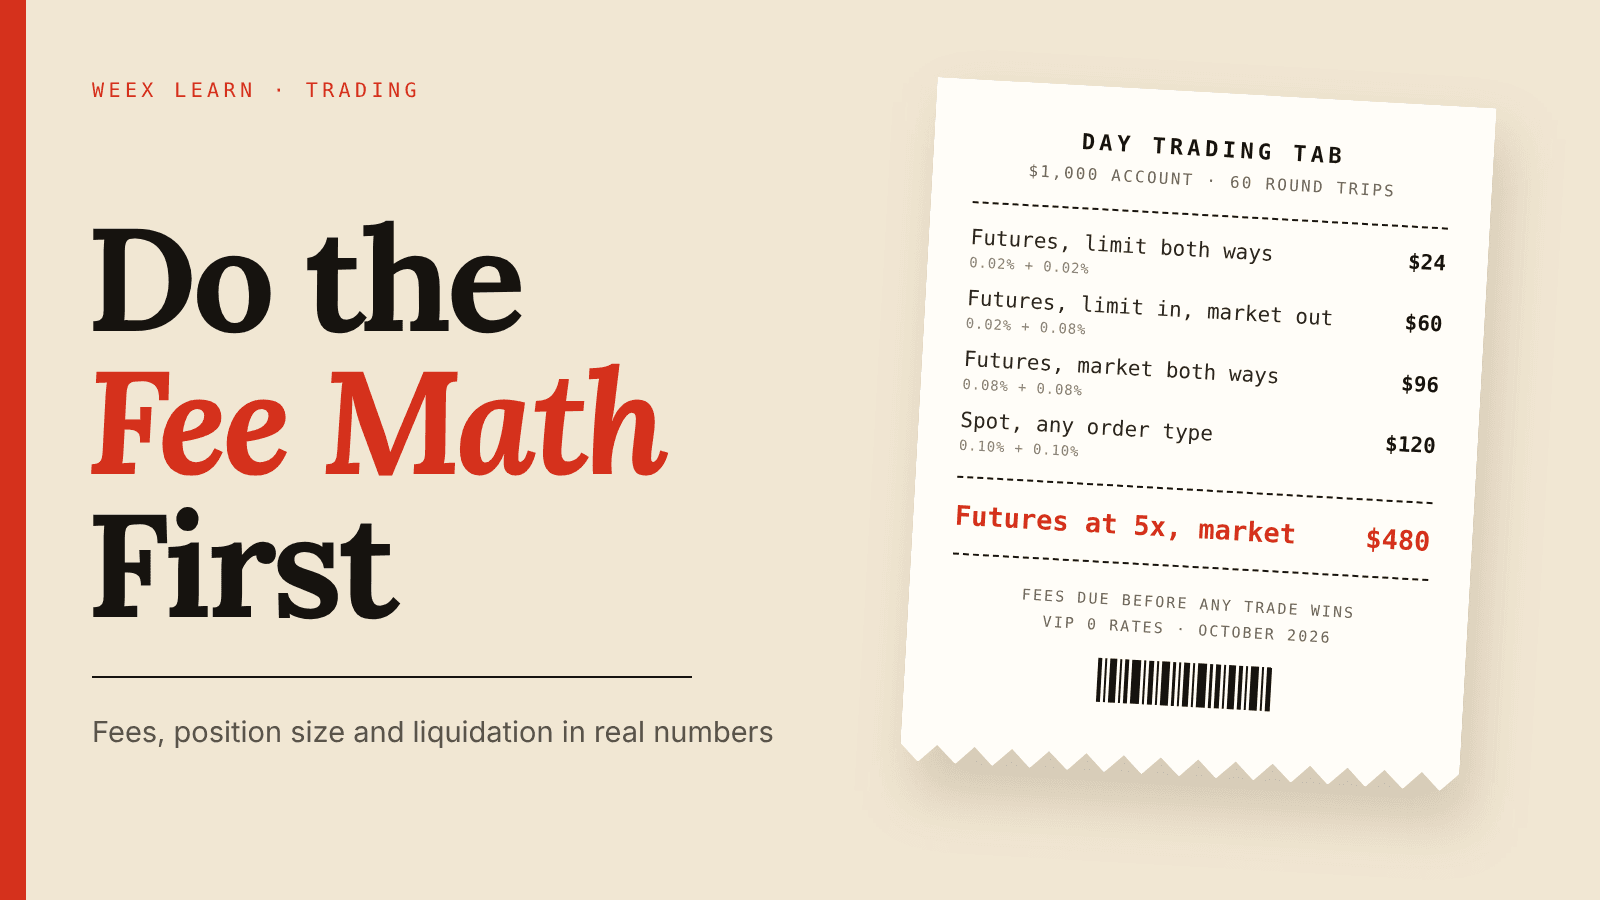
How to Day Trade Crypto for Beginners: Do the Fee Math First
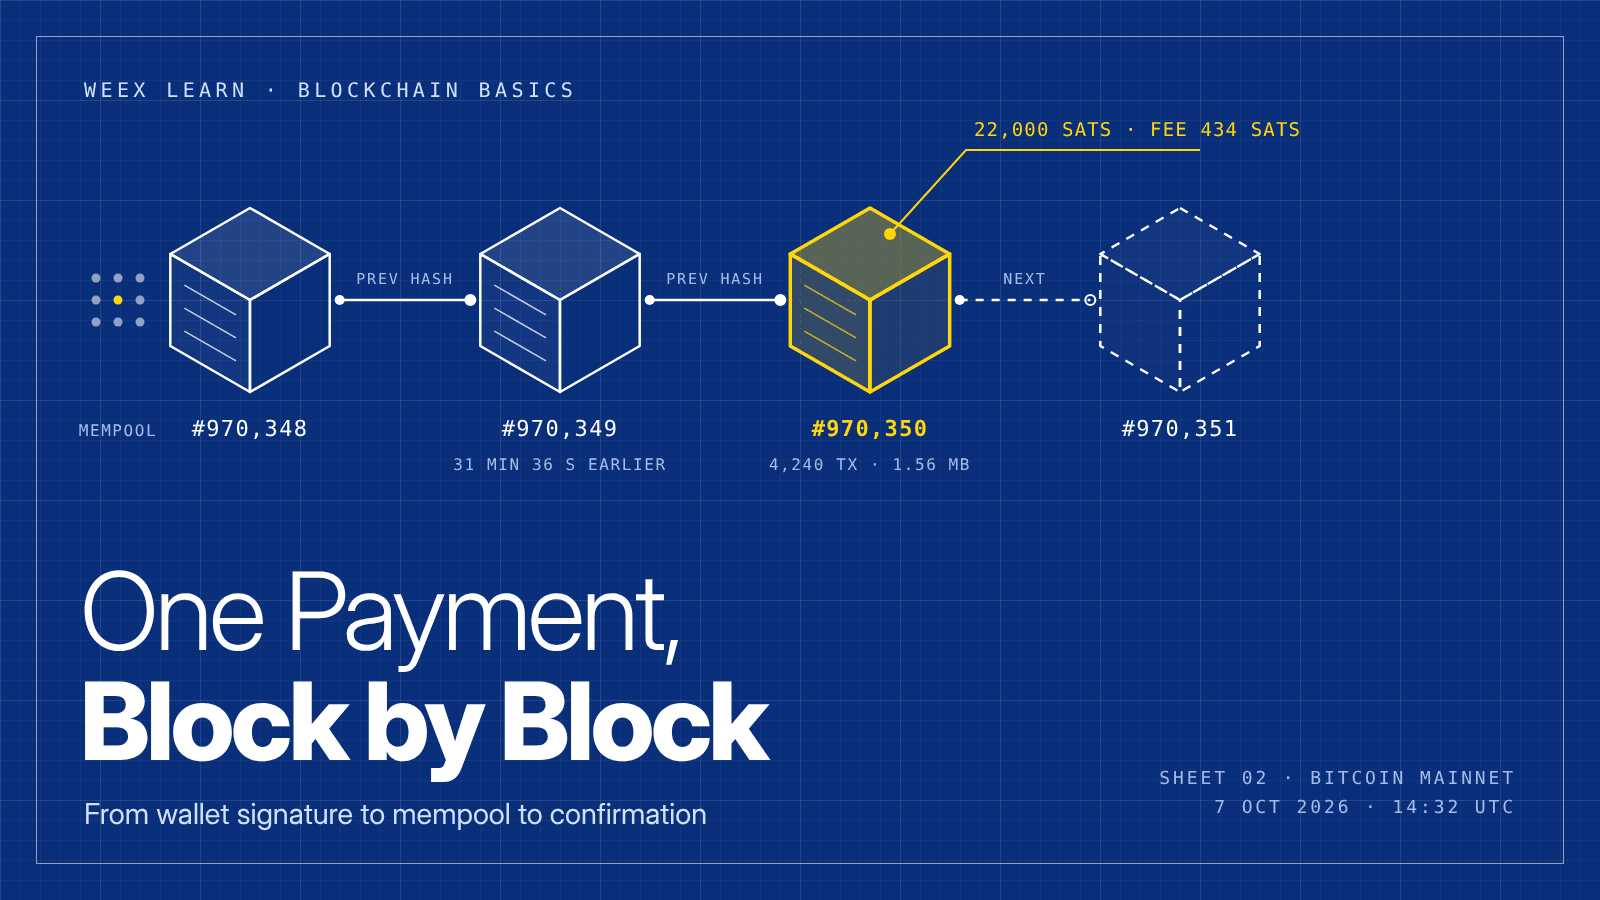
What Is Blockchain and How Does It Work? One Real Payment Traced
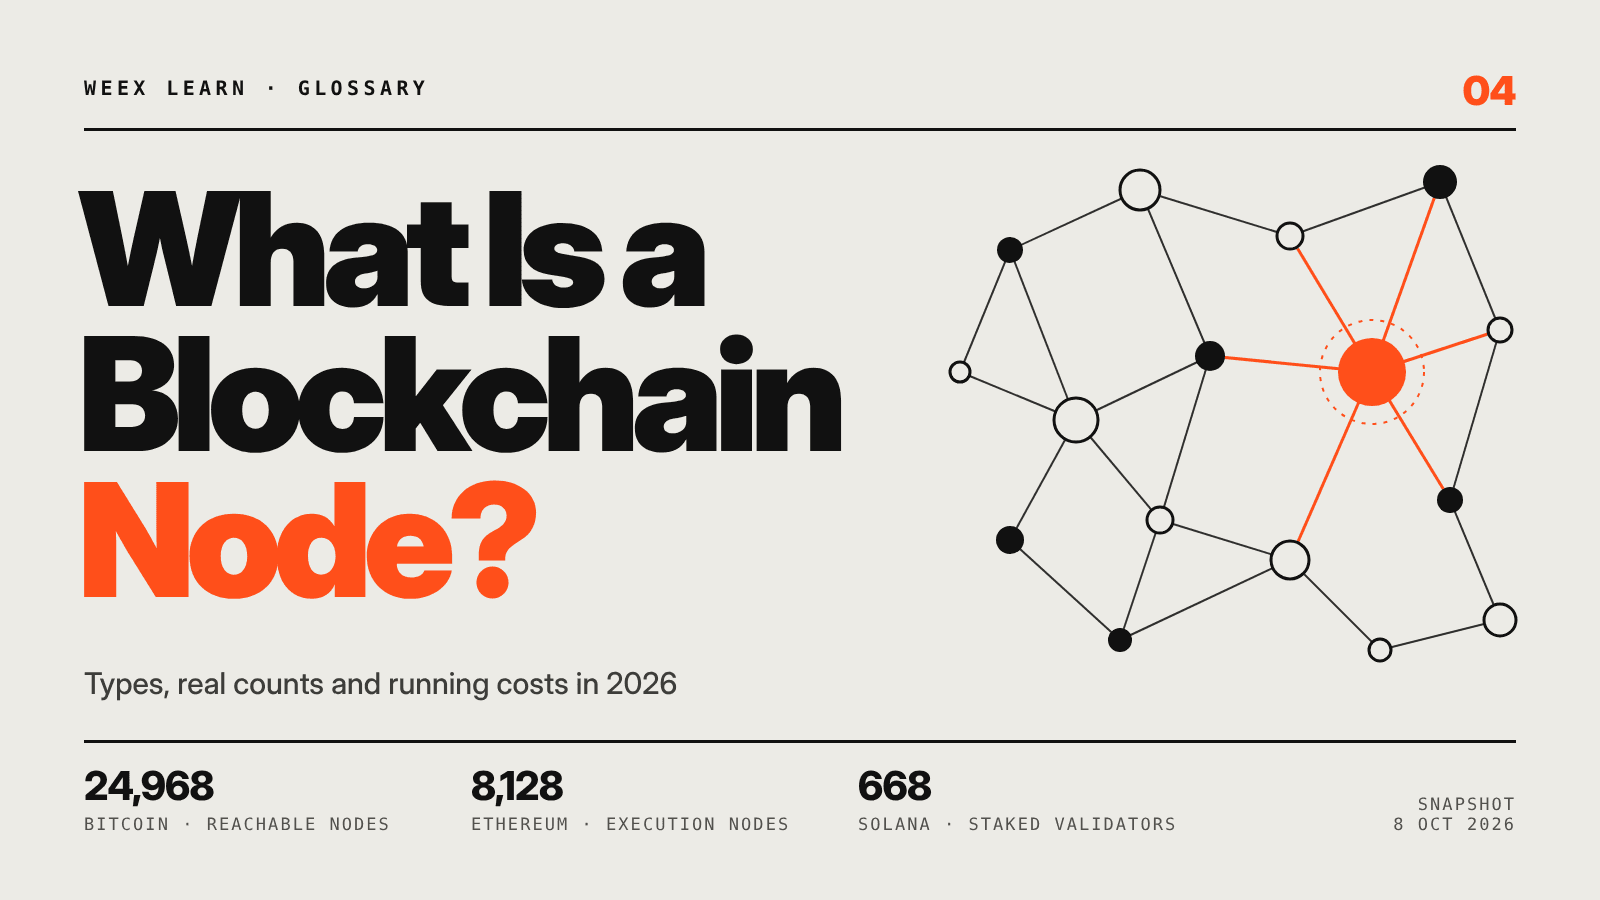
What Is a Blockchain Node? Types, 2026 Counts, and Real Costs

TSMC Stock Outlook Ahead of Q3 Earnings: Can AI Demand Push Shares Higher?

Taiwan Stock Market Nears 50,000: Can the TAIEX Break the Milestone After the Holiday?
How to Buy USDT in Thailand: Payment Methods, Fees and Transfer Checks

What Is RLC Crypto? How iExec (RLC) Powers Confidential Computing
Best Crypto Trading Strategies for Beginners: What to Know Before You Trade
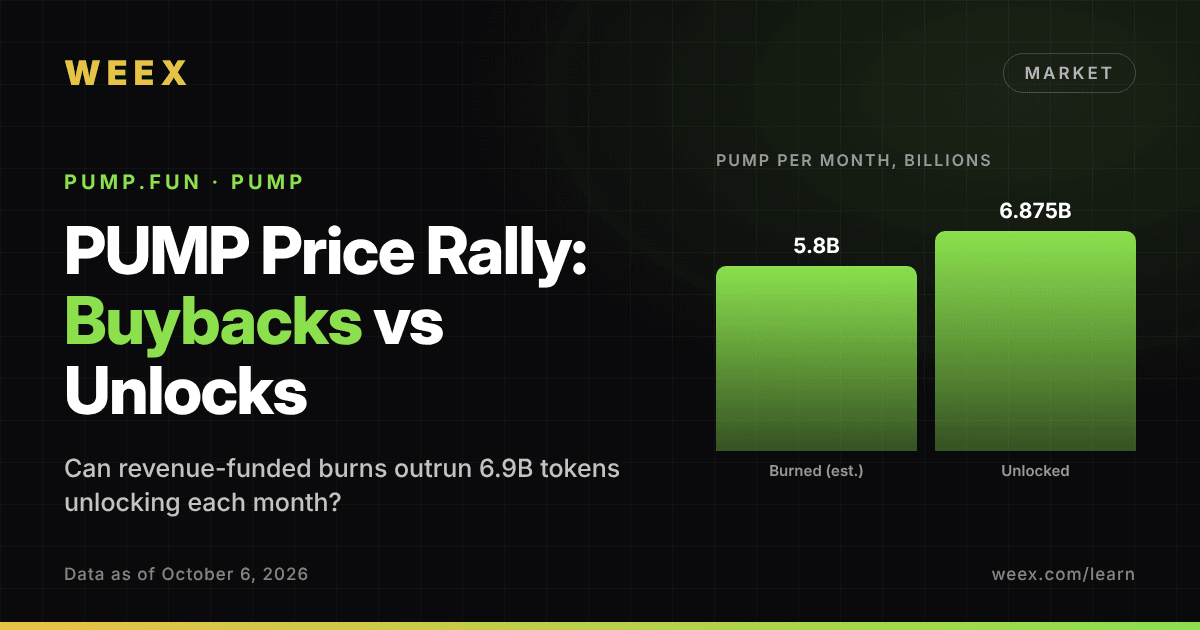
PUMP Price Rally: Can Pump.fun Buybacks Outrun Monthly Unlocks?
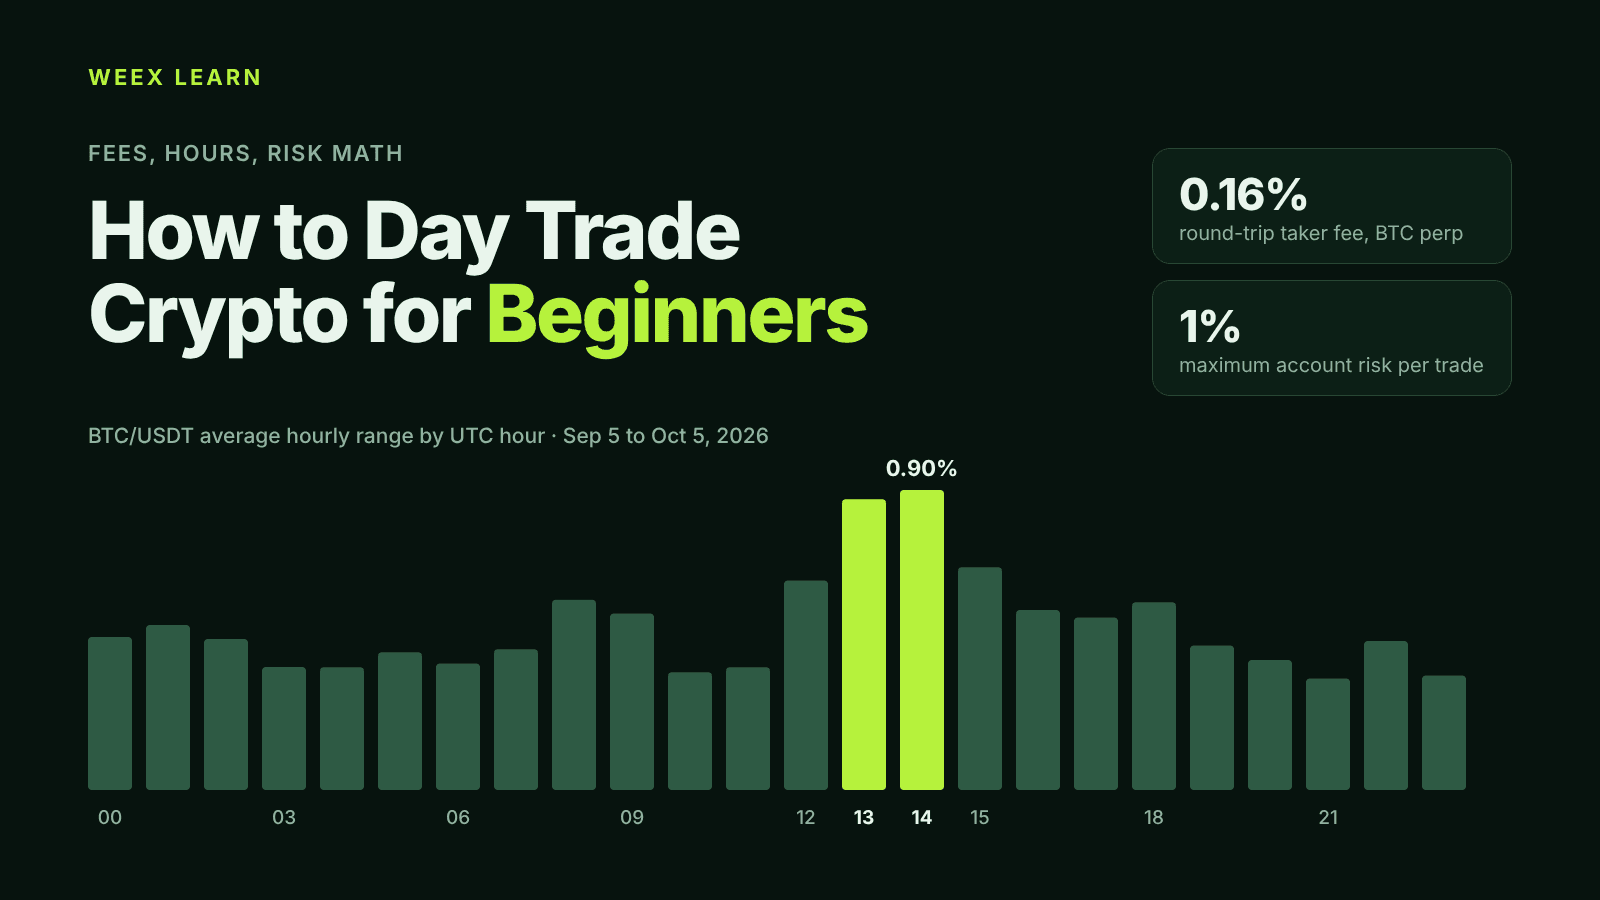
How to Day Trade Crypto for Beginners: Fees, Hours, Risk Math
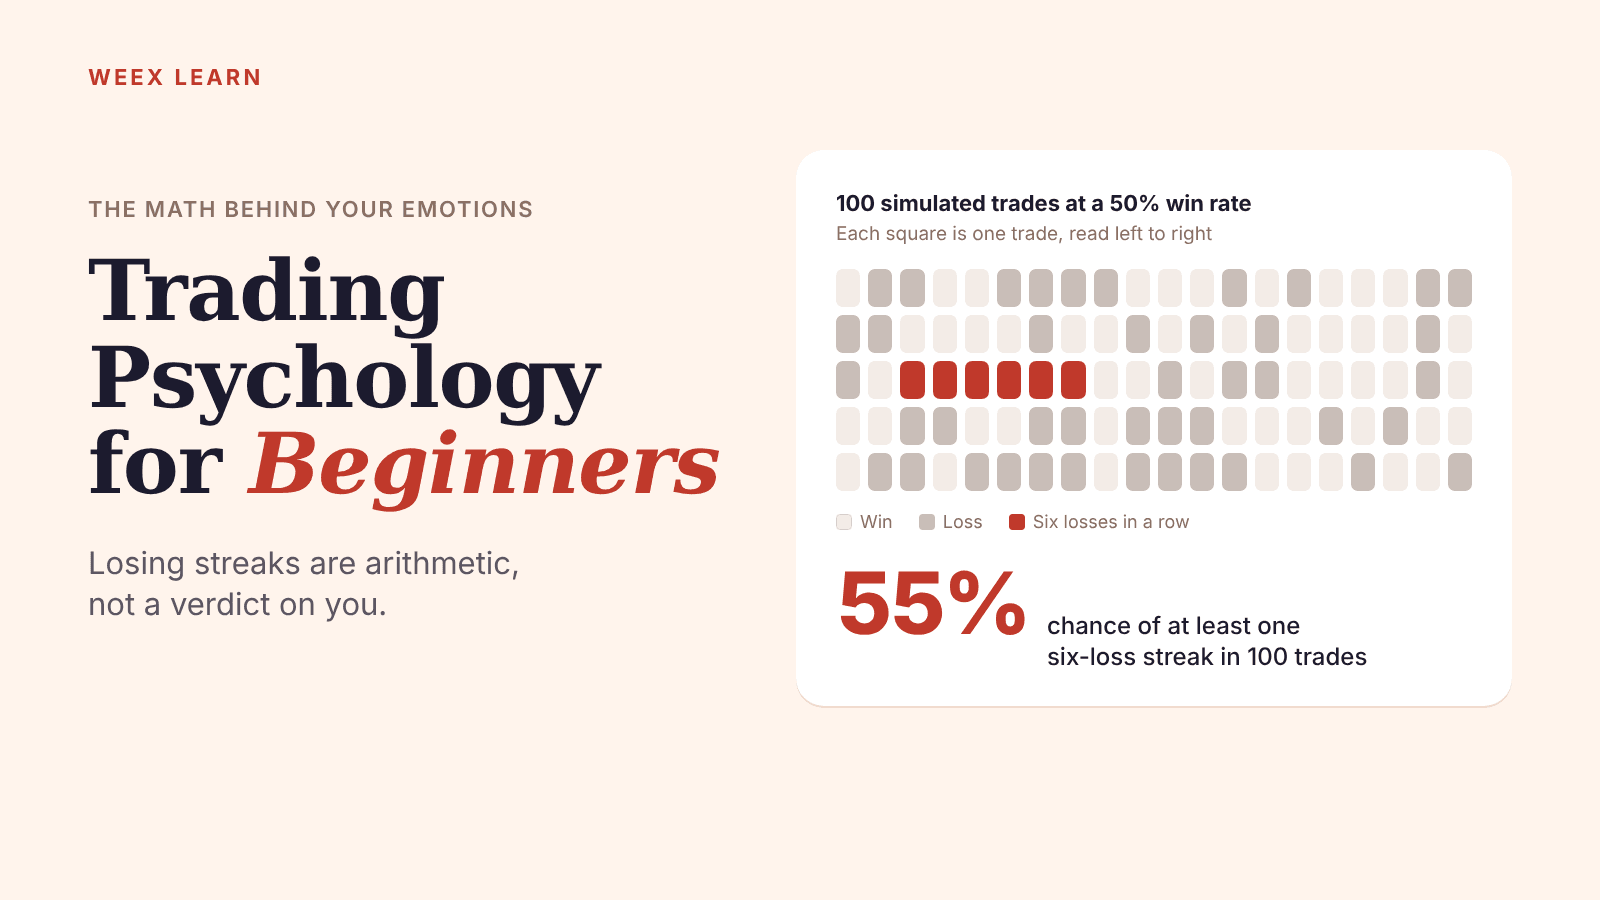
Trading Psychology for Beginners: The Math Behind Your Emotions
Best Crypto Apps for Beginners: The Five Features That Actually Matter on Your Phone

WEEX Passkey Now Secures Withdrawals: The 4 Actions It Covers
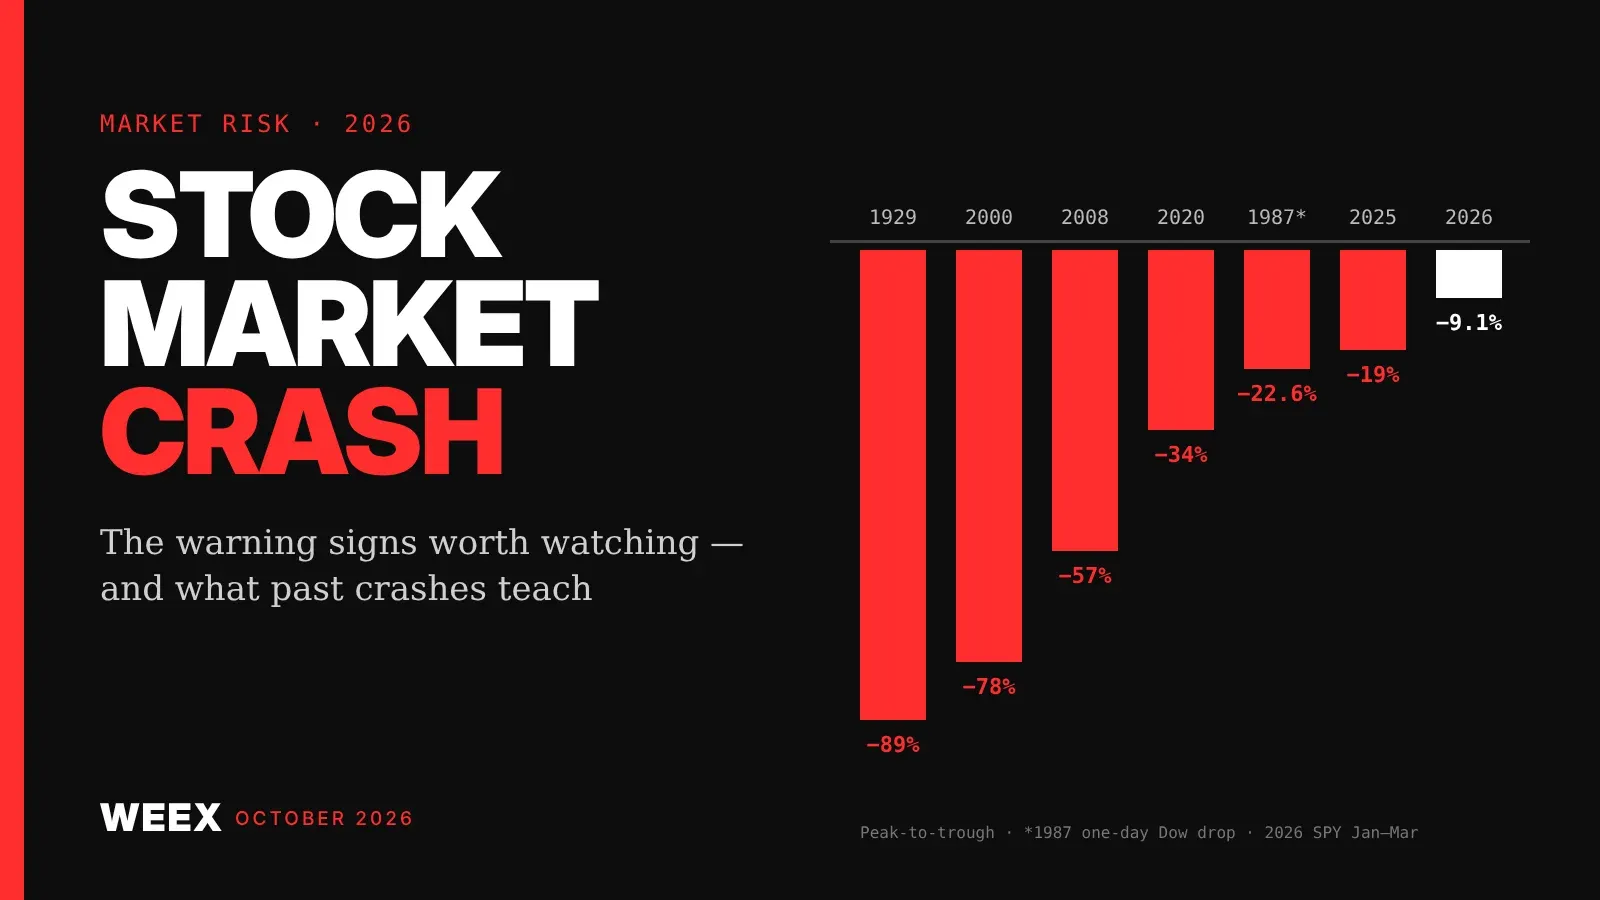
Stock Market Crash Risk in 2026: The Warning Signs Worth Watching
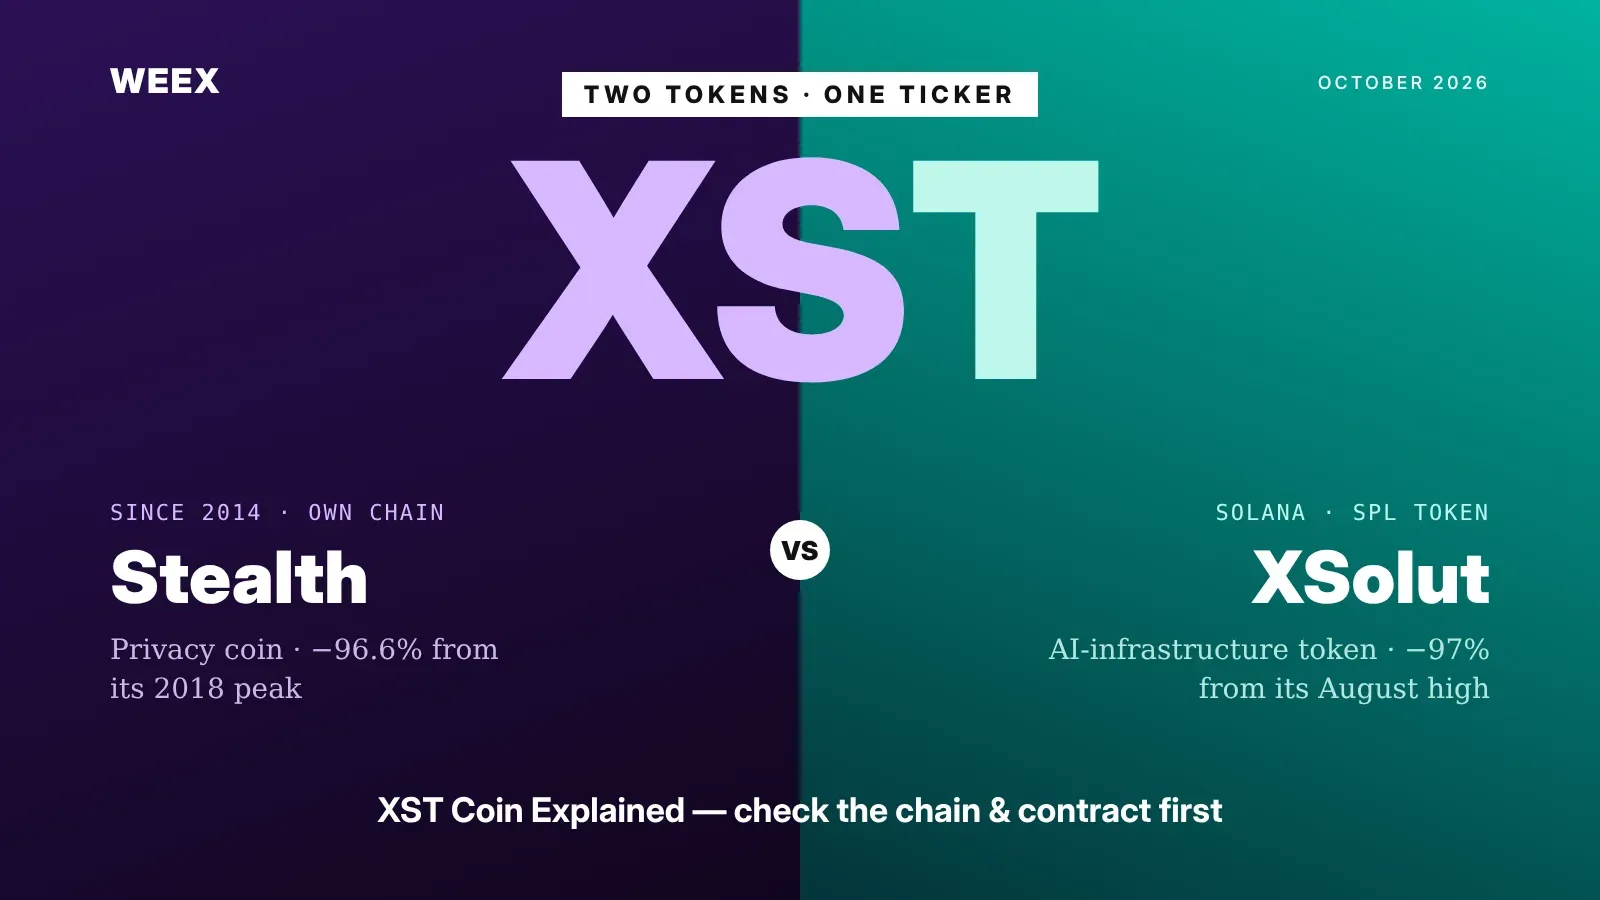
XST Coin Explained: Two Tokens Share One Ticker, Check Which One
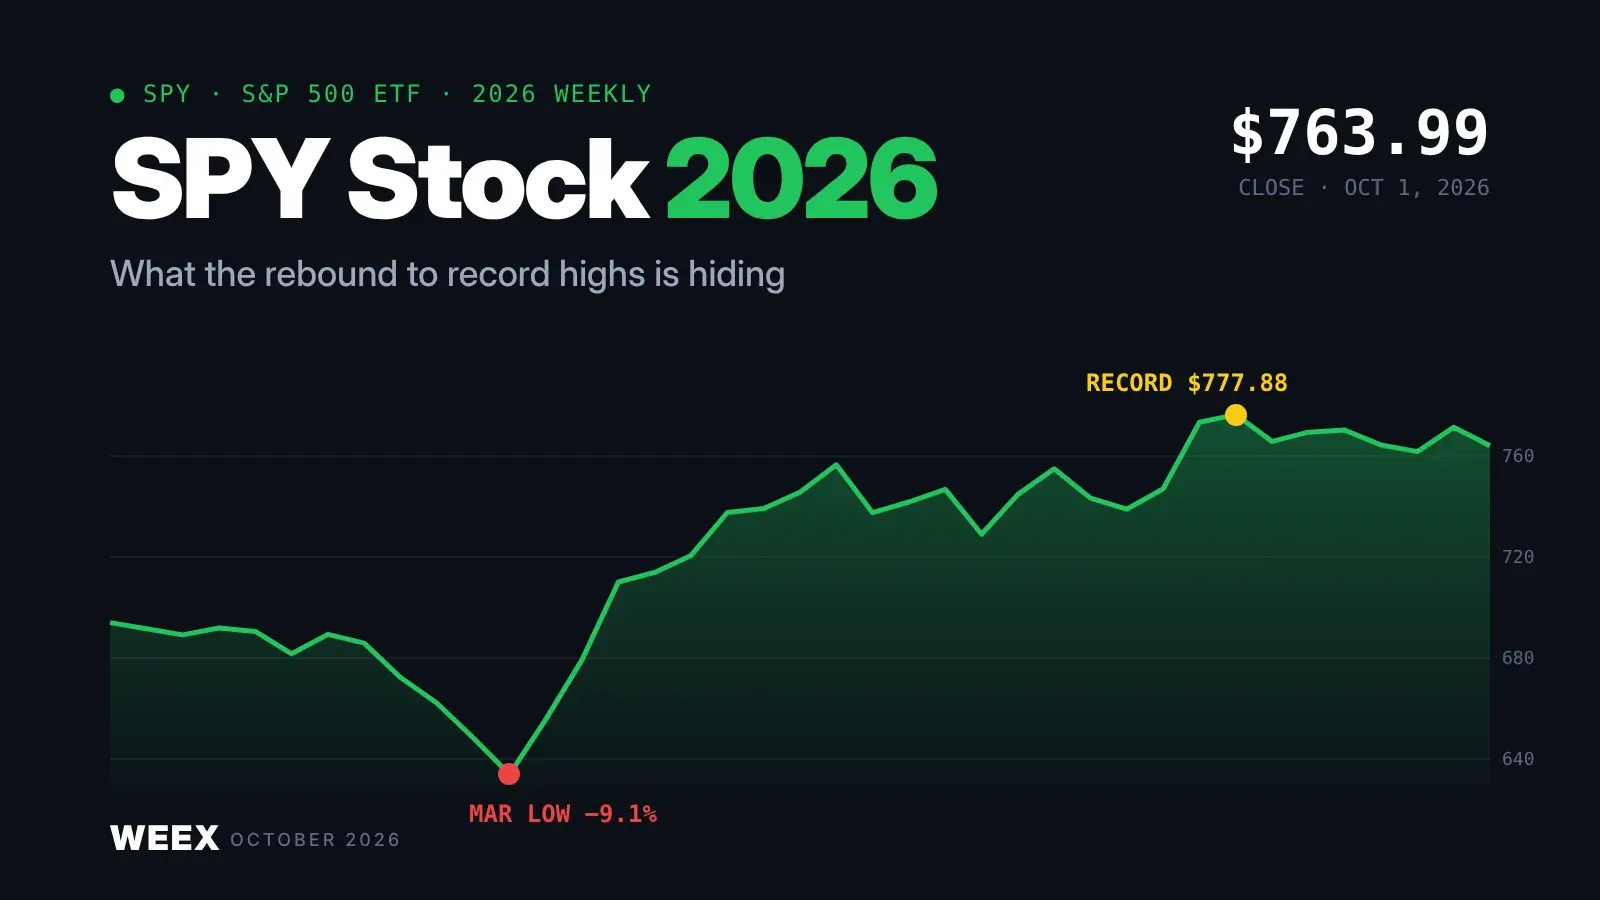
SPY Stock in 2026: What the Rebound to Record Highs Is Hiding
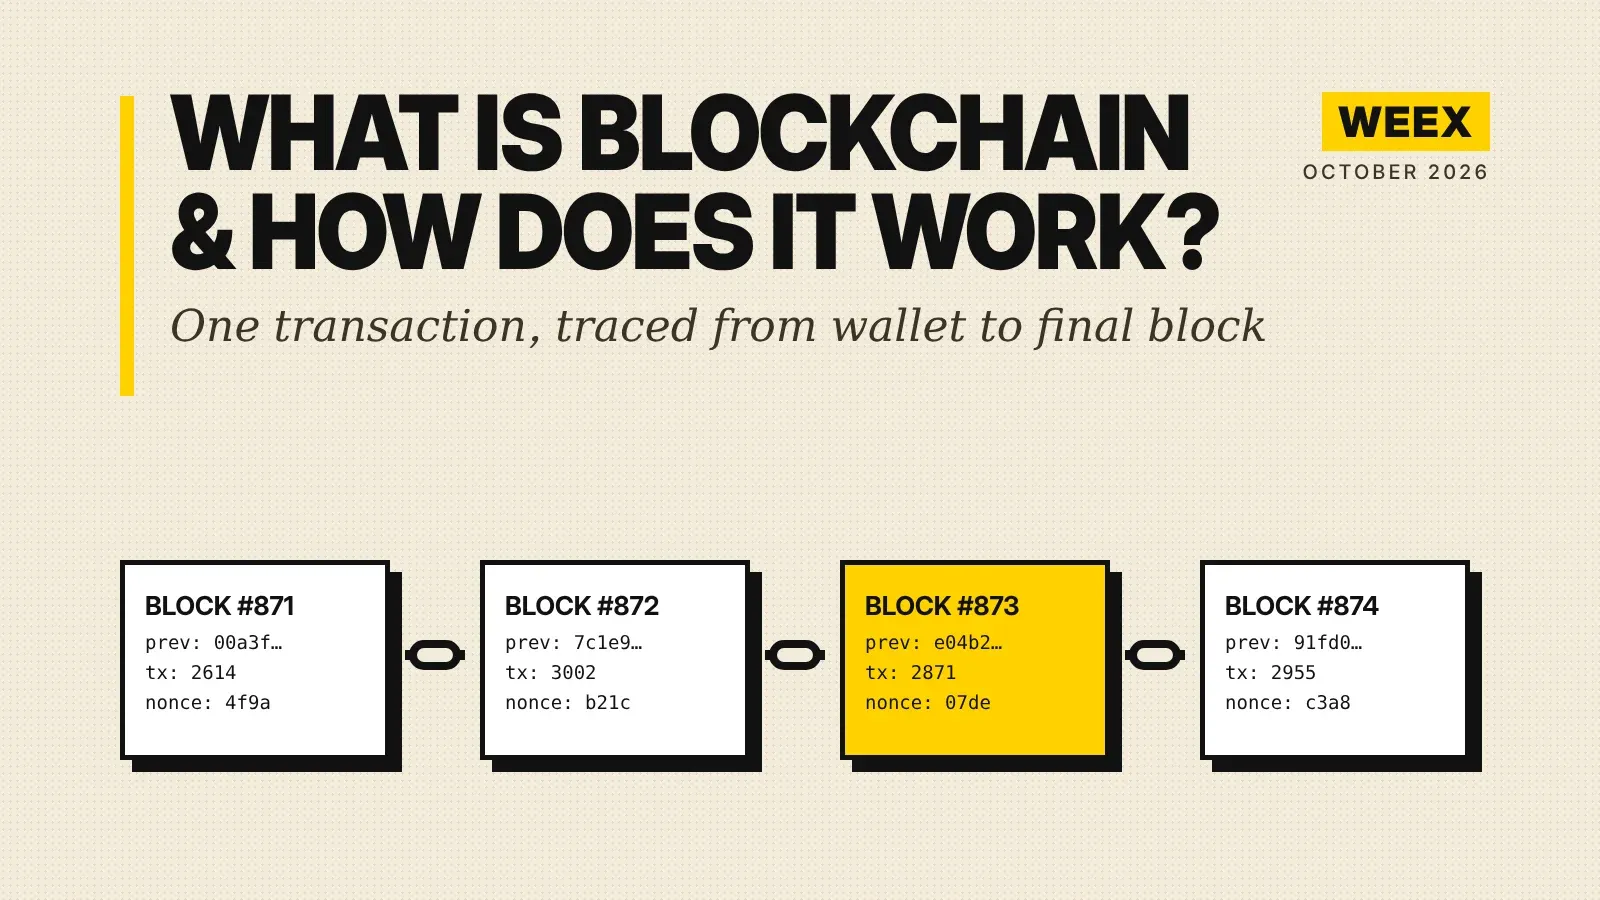
What Is Blockchain and How Does It Work? A Transaction Traced
How to Buy Crypto with PayPal: The Custody Catch Most Beginners Miss
Best Crypto Miner for Beginners: What to Check on Cost, Power, Hashprice and Profit Before You Buy
MU Stock Falls Below $1,000: Is the CXMT Threat Real or Just an Excuse to Take Profits?
Stop Limit Order: How It Works and Why It Can Fail to Fill
Best Crypto Podcasts for Beginners: A 4-Week Listening Plan
Will Bitcoin Break $87,000 This Week? CPI, Fed Speakers and ETF Outflows to Watch
Conflux (CFX) Price Jumps on China's National Blockchain Network Plan: Does the Policy Actually Name CFX?
Contents
Popular coins
Latest articles


