
Crypto Liquidation Heatmap: Reading the $972M Oct. 15 Long Flush

 Prefer us on Google

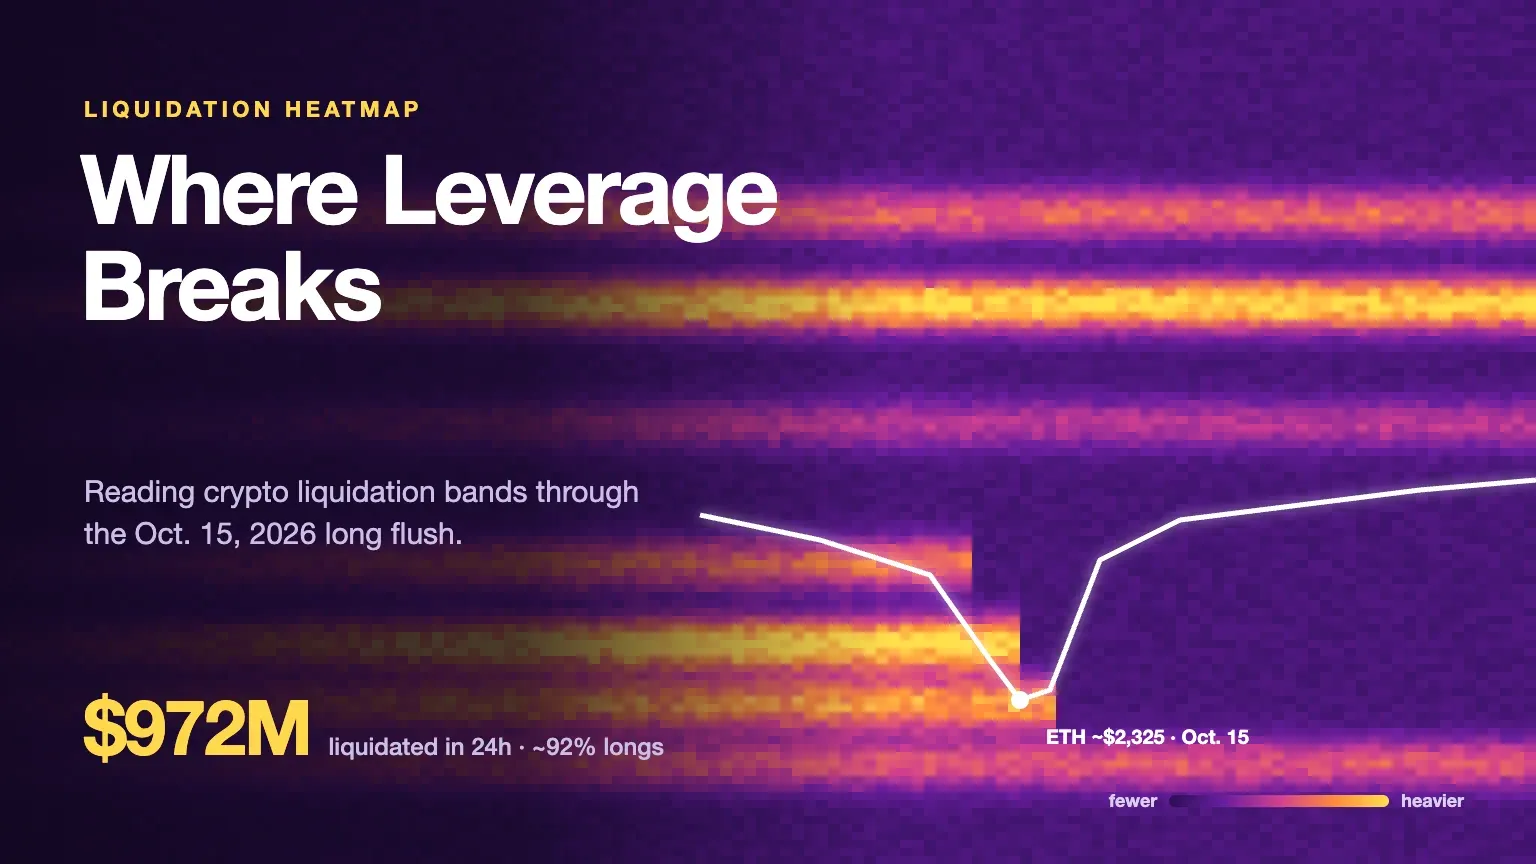
A crypto liquidation heatmap is a chart that estimates where leveraged futures positions would be force-closed, shading each price level by how much liquidation volume is expected there. Bright bands mark crowded leverage. They do not predict direction, but they show where a move could speed up, as it did on Oct. 15, 2026, when about $972 million of positions were liquidated in 24 hours.
That day is a useful test case because it was lopsided. According to CoinGlass data cited by Yahoo Finance, around 92% of the liquidations were longs, and ether, not bitcoin, led the losses even though ETH's open interest had barely moved in the days before. The heatmap showed the risk. Reading it correctly is the hard part.
Below is how the bands are built, how to interpret them using the Oct. 15 flush as the example, where the tool is weaker than it looks, and a short routine for checking whether your own position sits inside a danger zone.
How a Crypto Liquidation Heatmap Is Built
No exchange publishes the liquidation price of every open position, so a liquidation heatmap is an estimate. Providers such as CoinGlass combine open interest, recent price action and a range of assumed leverage levels, then calculate where positions opened at each price would hit their liquidation thresholds. The result is overlaid on the price chart.
The color scale is relative, not absolute. On CoinGlass's version it runs from purple, for few projected liquidations, to yellow, for heavy clusters. A yellow band on a quiet day may represent less money than an orange band in a busy week, so compare bands with each other on the same chart rather than across days.
Two features make heatmaps different from a plain liquidation chart:
- They are forward-looking. A liquidation chart records positions that were already closed. A heatmap shows where future closures would cluster if price travelled there.
- They update as positions change. When leverage is added at a new price, a new band appears below it for longs and above it for shorts. When a band is hit, it fades because those positions no longer exist.
If you trade bitcoin specifically, our walkthrough of how to read a BTC liquidation heatmap without guessing the bottom covers the BTC chart in detail. The rest of this piece applies to any asset, with ether as the example.
What the Oct. 15 Liquidations Showed on the Heatmap
Here is the sequence, with the data points that mattered:
- Leverage was steady, not rising. Ether's open interest held near 6.23 million ETH from Oct. 4 to Oct. 14, ranging between 5.97 million and 6.47 million, per data cited by Yahoo Finance on Oct. 16. Dollar open interest fell about 11% over the same stretch, mostly because the price fell.
- The bands sat below price. With longs holding size into a slow decline, estimated long liquidations stacked up beneath the market. That is the classic setup: a dense band below price, and little on the short side above.
- Price walked into them. ETH dipped to about $2,325 on Oct. 15. Liquidations reached roughly $972 million across 182,574 traders, about $891 million of it longs. ETH accounted for about $283 million, more than bitcoin's roughly $196 million.
- The bands were consumed. ETH recovered to about $2,452 by Oct. 16. Once the long cluster had been liquidated, the selling that came from it was gone.
The lesson is not that the heatmap called the bottom. It is that the heatmap showed where forced selling would accelerate, and that the bounce came after those positions had been cleared. Traders often describe dense bands as "magnets." The better reading is that they are fuel: price does not have to go there, but if it does, the move tends to speed up.
Where Liquidation Heatmaps Mislead Traders
Heatmaps look precise. They are not, and four gaps explain most bad trades built on them.
First, the leverage mix is assumed. The tool guesses how much leverage was used at each entry. If traders actually used 5x rather than 25x, the true liquidation levels sit much further from price than the bands show.
Second, coverage is partial. A heatmap only knows about the exchanges in its data feed. Positions on venues it does not track are invisible, and so are positions in spot margin accounts.
Third, liquidations do not happen at one line. Exchanges often reduce large positions in steps. WEEX, for example, cancels open orders, offsets two-side positions and reduces positions by two tiers at a time before a full liquidation, according to its liquidation process rules. A single band on the chart can therefore play out as a series of smaller sales spread across a range.
Fourth, the start is clearer than the end. A heatmap shows where a chain of liquidations is likely to begin. It cannot tell you how far the chain will run, because that depends on order-book depth, spot flows, funding and news.
The practical takeaway: treat a band as a zone of higher risk, not a target with a price tag.
-- Price
How to Read a Liquidation Heatmap Step by Step
A routine that holds up across most heatmap tools:
- Choose the pair and a timeframe that matches your trade. A 24-hour view suits intraday positions; a 7-day or 30-day view shows the larger clusters that build over weeks.
- Find the nearest bright band above and below price. Note the distance to each as a percentage. The closer and brighter band is the more likely short-term pressure point.
- Cross-check open interest. Rising open interest with a growing band means fresh leverage is being added. Falling open interest with a fading band means leverage is already leaving.
- Check funding. Positive funding with heavy long bands below price suggests a crowded long. Negative funding with short bands above price is the mirror image. On WEEX, ETHUSDT funding was 0.000196% per 8-hour interval on Oct. 22, 2026, close to neutral after the flush. Our guide to BTC funding rate and open interest explains how to read the two together.
- Place your own liquidation price on the map. If it sits inside or just beyond a bright band, your position will be liquidated in the same move as everyone else's, usually at the worst fill of the day.
Using the Heatmap to Protect Your Own Position
The most useful thing a heatmap tells an individual trader is whether their risk is crowded. A stop-loss or liquidation price placed a little past an obvious cluster is a common mistake, because the cluster tends to overshoot when it unwinds.
Two adjustments help. Lower the leverage until your liquidation price sits outside the nearest dense band, or place a stop-loss above the band so you exit before the cascade starts. On a WEEX ETHUSDT perpetual opened at 2,440 USDT on Oct. 22, a 25x isolated long would be liquidated near 2,348 USDT, above the 2,325 low printed during the Oct. 15 flush. At 10x, liquidation moves down to about 2,201 USDT.
The heatmap cannot make that decision for you. It only shows where everyone else is standing.
Crypto Liquidation Heatmap: What to Take Away
A crypto liquidation heatmap is best used as a map of crowded leverage. The Oct. 15, 2026 flush followed the pattern it describes: steady long positioning, dense bands under price, a fast drop through them and a rebound once they were cleared. Use the bands to judge where moves may accelerate and to keep your own liquidation price out of the crowd, and check open interest and funding before trusting any single band. You can review ETHUSDT funding, tiers and live liquidation prices on WEEX before you size a trade.
FAQ
1. What does a crypto liquidation heatmap show?
It estimates the price levels where leveraged futures positions would be liquidated, shading each level by expected liquidation volume. Bright bands mark heavy clusters of leveraged longs or shorts.
2. Are liquidation heatmaps accurate?
They are estimates. They assume a mix of leverage levels and only cover the exchanges in the provider's data, so the real liquidation levels can differ. They are more reliable for spotting crowded zones than for exact prices.
3. Do prices always move toward liquidation clusters?
No. Clusters are often described as magnets, but price can ignore them. When price does reach a dense band, the forced orders tend to make the move faster.
4. How can I avoid being liquidated in a cluster?
Use lower leverage so your liquidation price sits outside the nearest dense band, or set a stop-loss that exits before the band is reached. Checking funding and open interest helps judge how crowded the trade is.
This content is provided for general informational purposes only and doesn't constitute financial, investment, legal, or tax advice. Any events, rewards, online promotions, or related information mentioned herein should not be considered a recommendation, solicitation, or invitation to purchase, sell, trade, or otherwise deal in any crypto assets. Crypto assets are highly volatile and may result in loss. The availability of WEEX services, products, and related events may vary by region. You are responsible for ensuring that your participation is in accordance with applicable local laws and regulations.
You may also like
Ethereum Funding Rate: How It Works and Why It Dropped Near Zero
Margin Trading Crypto: Cross vs Isolated and Liquidation Math
How to Convert BTC to USDT: A Step-by-Step WEEX Guide
xStocks Crypto Explained: What Tokenized Stocks Are, How They Work and What Holders Should Check
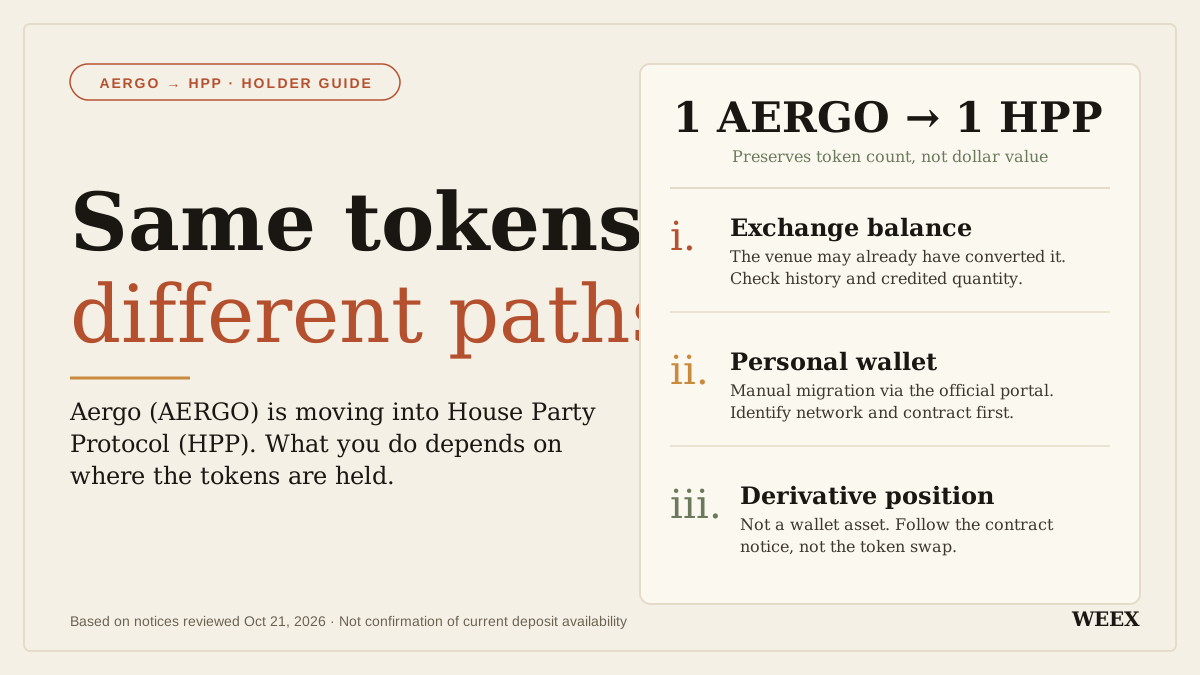
What Happened to Aergo (AERGO) Crypto? Token Migration and What Holders Should Do
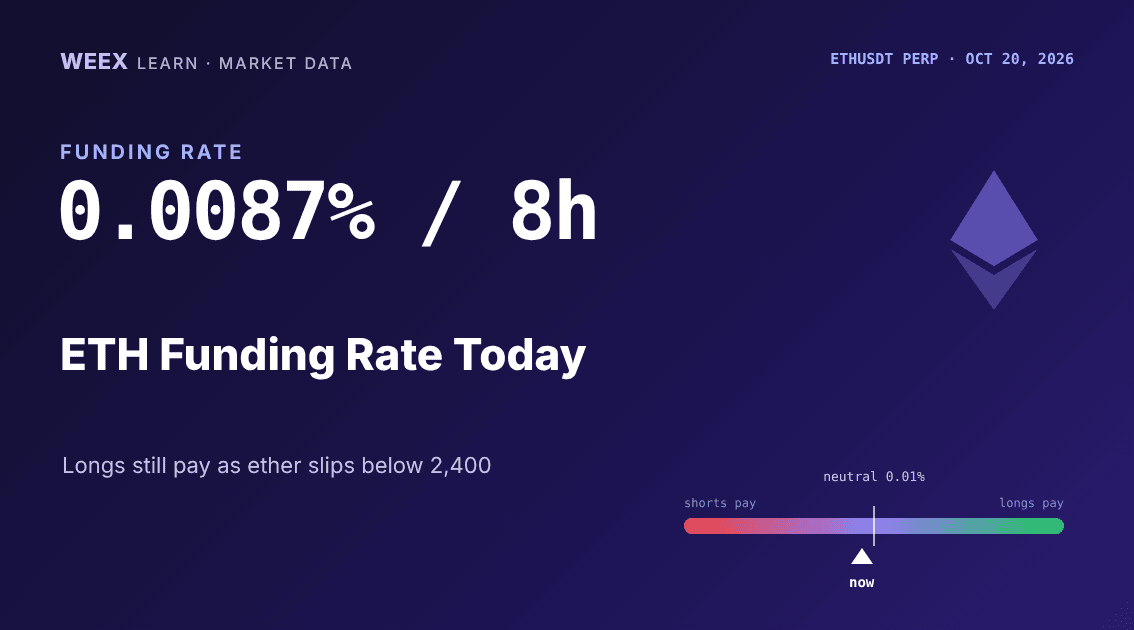
ETH Funding Rate Today: 0.0087% per 8h as Ether Longs Re-Lever
What Is Blockchain and How Does It Work? One Transaction, Traced
Staking APR vs Inflation: How Much of Your Crypto Yield Is Real?
WEEX Convert Fees: What Zero-Fee Conversion Really Costs You
WEEX Convert Quote: How the 8-Second Price Lock Really Works
WEEX Convert Limits: Minimum and Maximum Amounts Explained
How to Check a WEEX Convert Order: History, Rate and Status
Bitcoin Price After Hot CPI: Why BTC Is Pinned Near $82,000
Limit Sell Order: How to Set a Take-Profit Price in Crypto

Best Crypto Podcasts for Beginners: A 4-Week Listening Plan
What Is Plume (PLUME)? Why the RWA Token Stays 93% Below Its High Even After the Layer 2 Rally
ETH Futures: Why Ether Is Falling Faster Than Bitcoin This Week
How to Buy Presale Crypto: Step by Step Guide for Beginners
Ethereum Glamsterdam Hits 200M Gas on Sepolia: What Changes After the Upgrade?
What Is Staking? 4 Myths to Clear Up Before You Stake Crypto
CAP Price Up 23%: Why Short Liquidations Don't Explain the Rally
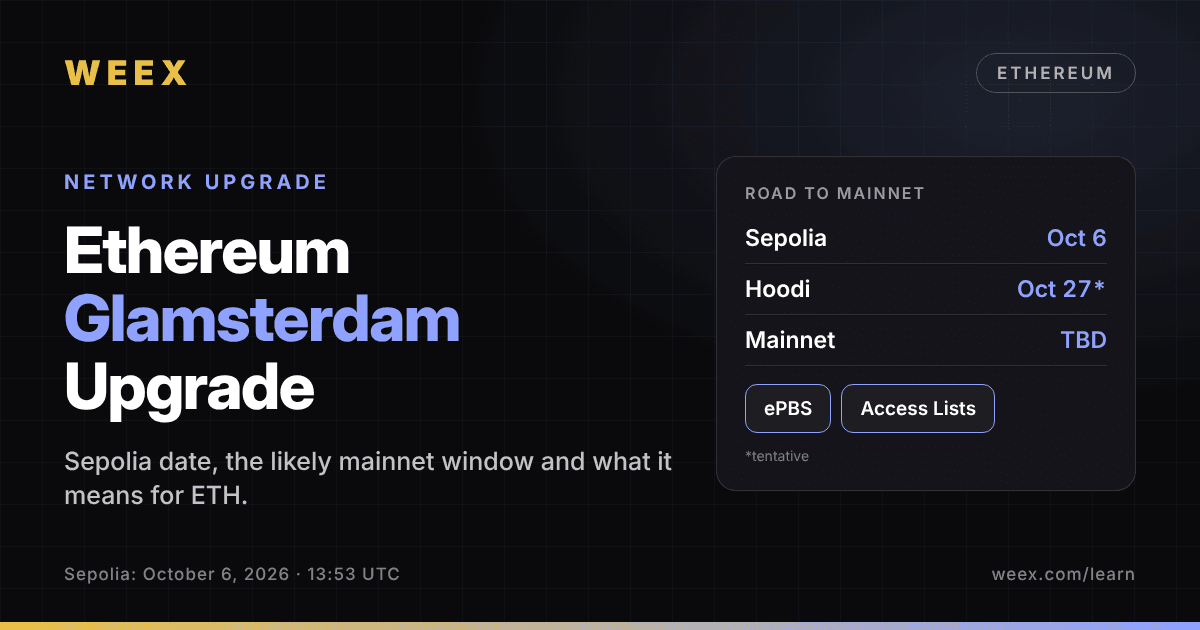
Ethereum Glamsterdam Upgrade: Sepolia Date and ETH Price Impact
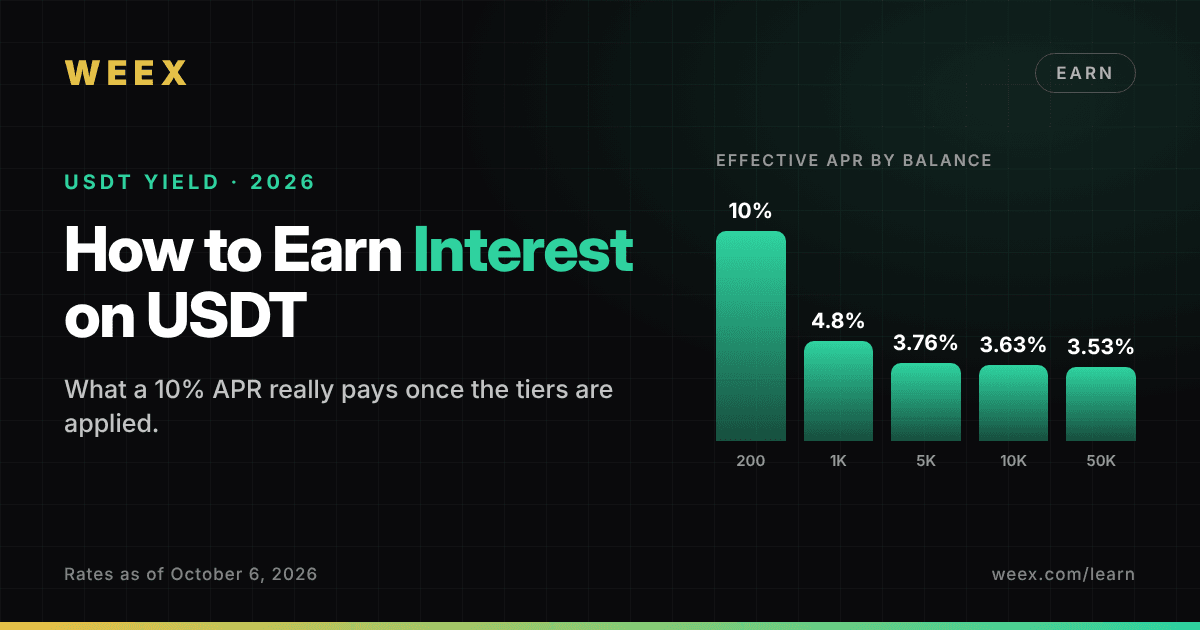
How to Earn Interest on USDT: What a 10% APR Really Pays in 2026
How to Buy Crypto With Apple Pay in 5 Steps: Why Your Bank May Decline the Payment
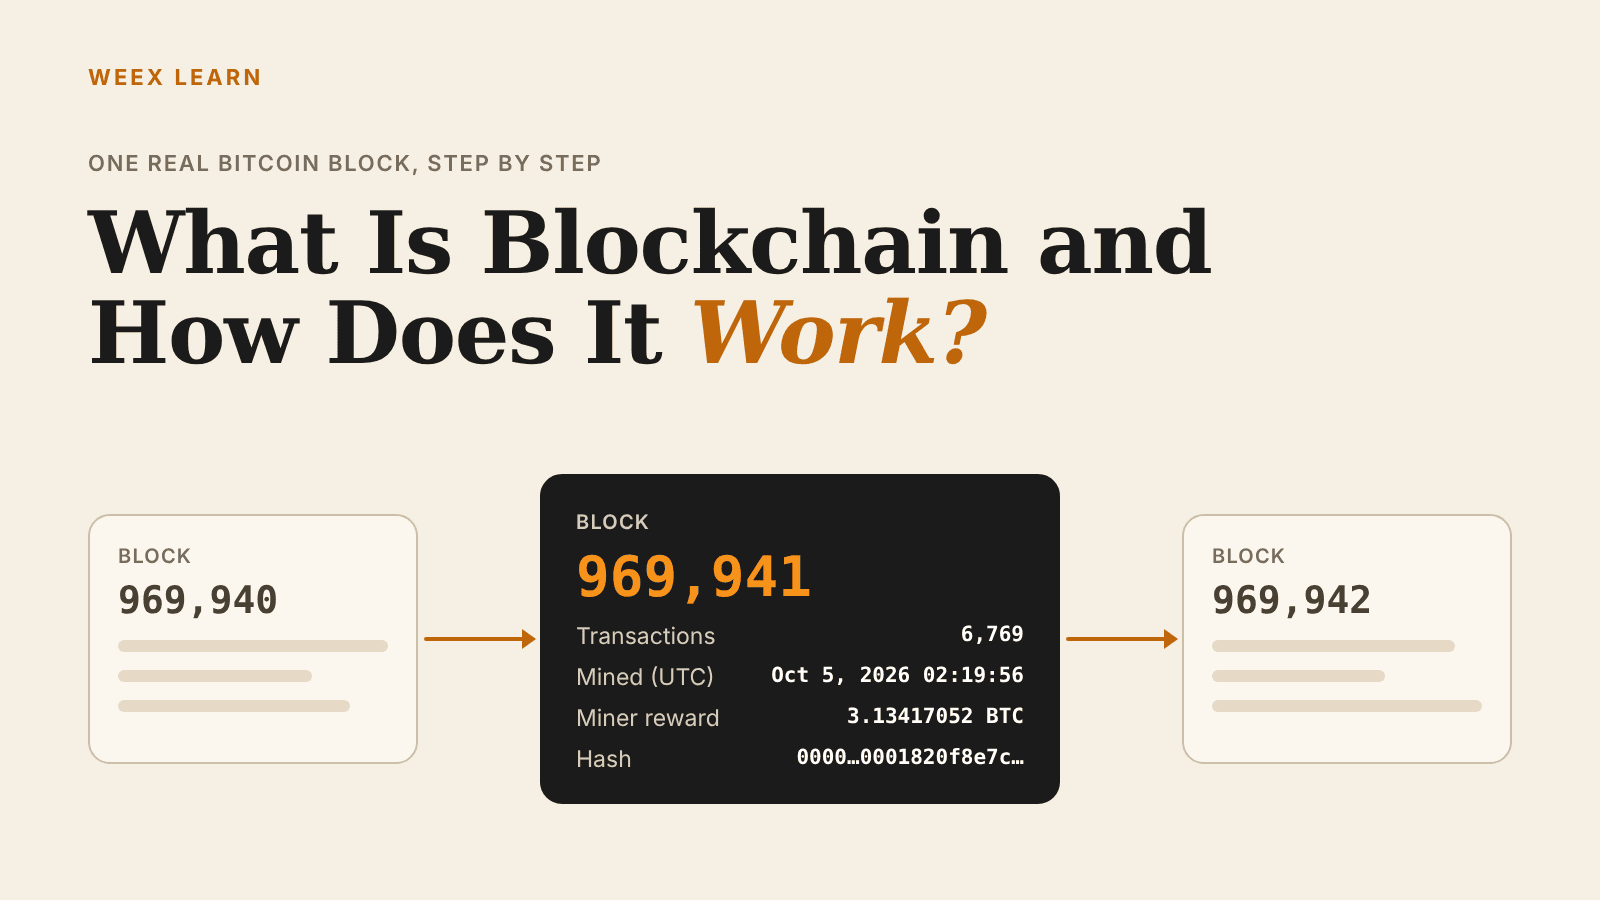
What Is Blockchain and How Does It Work? One Real Block Explained
Ethereum Glamsterdam Upgrade Countdown: Can ETH Price Break Out?
Anonymous Crypto Wallet: What Still Protects Your Privacy in 2026
How Tether Freezes USDT: Address Blacklists and Holder Checks
Bitcoin Futures at $83K: PnL and Position Sizing Into Jobs Week
Ethereum 2030 Roadmap: Vitalik's Cryptographic World Computer
Ethereum Funding Rate: How It Works and Why It Dropped Near Zero
Margin Trading Crypto: Cross vs Isolated and Liquidation Math
How to Convert BTC to USDT: A Step-by-Step WEEX Guide
xStocks Crypto Explained: What Tokenized Stocks Are, How They Work and What Holders Should Check
What Happened to Aergo (AERGO) Crypto? Token Migration and What Holders Should Do
ETH Funding Rate Today: 0.0087% per 8h as Ether Longs Re-Lever


