
Mr&强 Shares Methods for Identifying Market Bottom Signals

 Prefer us on Google


According to Twitter user Mr&强, determining whether the market has shown signs of a bottom requires analyzing K-line trends across different time frames and key support levels. The weekly support range is around $62,700 to $65,000, and it is essential to observe the price's reaction in this area for signs of a bottom. On the daily chart, focus on the descending channel and key support levels to look for breakout signs. On the 4-hour level, observe the price structure and consolidation range, while on the 1-hour level, look for specific entry points. Importantly, managing risk is crucial rather than trying to catch the lowest point.
-- Price
This content is provided for general informational purposes only and doesn't constitute financial, investment, legal, or tax advice. Any events, rewards, online promotions, or related information mentioned herein should not be considered a recommendation, solicitation, or invitation to purchase, sell, trade, or otherwise deal in any crypto assets. Crypto assets are highly volatile and may result in loss. The availability of WEEX services, products, and related events may vary by region. You are responsible for ensuring that your participation is in accordance with applicable local laws and regulations.
You may also like

Logistics Giant GXO Expands into Data Centers and Defense Business to Boost Profit Margins

Venezuela: cryptocurrency exchange linked to Nicolás Maduro's son intervened

Rising Transportation Costs Make Large Holiday Purchases More Difficult

Activist Investors Urge Invitation Homes to "Sell Off" Properties One by One

Goldman Sachs: Hedge Funds Net Sell U.S. Stocks for Two Consecutive Weeks, Tech Stock Long-Short Ratio Drops to 1.50

Future Capital Expenditure of Fuhua Co., Ltd. Focused on Anode Materials for the Next Two to Three Years

Mr&强 Reveals Ethereum Address Theft Incident

Mr&强 Attends WEEX Anthropic Event

Elon Musk's AI Team Lays Off Most of Grok Video Generation Project
Baidu Q3 Net Profit Exceeds Expectations, AI Cloud Revenue Soars 94%, Token Call Revenue Grows 1159%
Barclays Expects S&P 500 to Rise 15% by End of 2027

What Licenses Are Needed for Crypto Payments in Hong Kong?

Apple Launches New App to Study How People Use AI for Health Information

US Futures Rise, Japan Contracts, China Slows

European Banks' Risk Transfer Business Thrives, 'Passive Deleveraging' Risks Rise
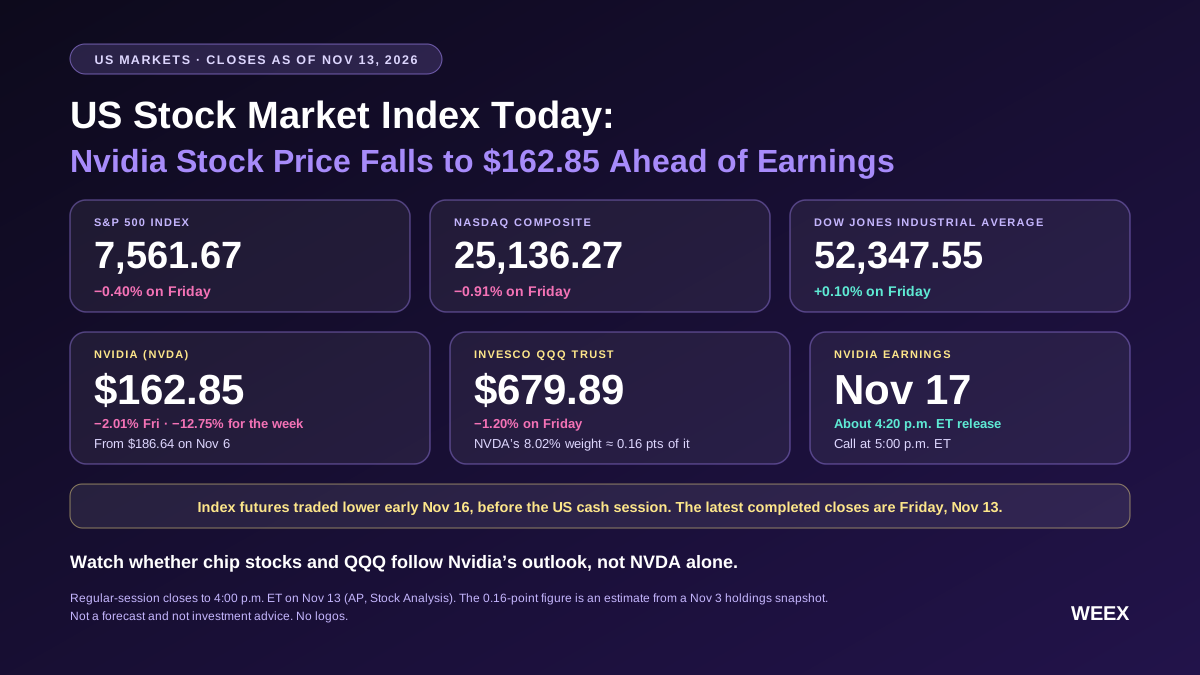
US Stock Market Index Today: Nvidia Stock Price Falls to $162.85 Ahead of Earnings(S&P 500 and QQQ )
Track US stock index futures, the S&P 500 and Dow, and see how Nvidia’s $162.85 close and November 17 earnings could shape QQQ and the broader market.

Options Big Bets | Nvidia's $118 Million Cross-Period CALL Spread Bets on Mid to Long-Term Upside; AMD's Bearish Spread Combined with Long-Term Bullish Spread, Underlying Tensions Between Bulls and Bears

Why Are Investors with $15 Billion No Longer Just Investing in Cryptocurrency?

Morgan Stanley Recommends Overweighting Global Stocks, Maintains Overweight Rating for U.S. Stocks
Morgan Stanley Raises S&P 500 Target for 2027 to 8,700 Points

Is Meta Stock Still a Buy After Borrowing About $25 Billion This Month?

Why Investors Should Own Businesses That Can Win Under Any Administration
Coinone Customer Data Breached, Accounts Require Two-Factor Authentication

Costco Declares $30 Special Dividend, Totaling $13.3 Billion
U.S. Bancorp Pays Out 40% of Its Profit as Dividends. Here's How Much Room It Has to Raise Them.
Stocks Have Risen a Year After Every Midterm Since 1950. Here’s What That Does and Doesn’t Tell You.

Is Credo Technology a Better AI Networking Buy Than Broadcom?
The Stock Market Is Doing Something for Only the 6th Time in 156 Years, and History Says It's Clear What Comes Next for Stocks

History Says Every S&P 500 Bear Market Has Ended the Same Way. Here's the Pattern.
Nvidia's Ousted CEO Said a 1-Gigawatt Data Center Delay Costs $10 Billion a Quarter. Here's Why That Matters for Power Stocks.
Logistics Giant GXO Expands into Data Centers and Defense Business to Boost Profit Margins
Venezuela: cryptocurrency exchange linked to Nicolás Maduro's son intervened
Rising Transportation Costs Make Large Holiday Purchases More Difficult
Activist Investors Urge Invitation Homes to "Sell Off" Properties One by One
Goldman Sachs: Hedge Funds Net Sell U.S. Stocks for Two Consecutive Weeks, Tech Stock Long-Short Ratio Drops to 1.50
Future Capital Expenditure of Fuhua Co., Ltd. Focused on Anode Materials for the Next Two to Three Years
Latest articles


Latest coin listings on WEEX


