
Why Are Tokenized Stocks Seeing Strong Buying Pressure While Prices Keep Falling?

 Prefer us on Google



Who is pricing tokenized stocks? The answer is not at Kraken.
Written by: stein
Compiled by: Chopper, Foresight News
On Wednesday, October 28, buyers on Kraken were a bit anxious: all day long, they were aggressively buying tokenized NVIDIA stocks, with active purchases exceeding active sales by $224,000 at the close. As a result, the closing price fell by 1.85%. (Note: All times mentioned in this article are in local U.S. time)
This raises the question: why are a group of aggressive buyers losing money?
Stock prices are determined in places where real shares are traded, such as exchanges like NASDAQ and NYSE. They provide price references for on-chain stock tokens. However, once the stock market closes, these tokens must continue trading without any reference, leading to potentially outrageous price deviations.
With this question in mind, I reviewed the transactions of six tokenized stocks on Kraken over 60 trading days to see when buying pressure truly pushed prices and when it was just noise.
What I Looked At
I examined every transaction of six tokenized stocks on Kraken between September 14 and November 13, 2026: 159,002 transactions totaling $102 million.
Each transaction is tagged to indicate who was eager to bid. "Buy" means the buyer couldn't wait and took the seller's asking price; "Sell" means the seller couldn't wait and accepted the buyer's offer. This kind of "urgency" is what traders refer to as active transactions.
First, let's clarify a few concepts:
- Net Pressure: The dollar amount of active buying minus the dollar amount of active selling.
- CVD (Cumulative Volume Delta): Think of it this way. In the market, there are buyers and sellers; each time someone clicks "Buy Now," the buyer gets 1 point; each time someone clicks "Sell Now," the seller gets 1 point. CVD is the difference in clicks between the two sides. If there are 10 buys and 4 sells, CVD is +6.
- Price Reaction: How much the price moved, measured in basis points. 1 basis point = 0.01%, 100 basis points = 1%.
- Clock: U.S. stock trading hours (New York time 9:30–16:00), pre-market, after-hours, overnight, weekends.
Additionally, the activity levels of each token differ, so a $3,000 buy order means different things for them. To make a fair comparison, I set a "normal level" for each token. The specific method involved breaking the 60 days into one-minute intervals (10:00–10:01, 10:01–10:02, etc.), measuring the amount of "urgent buys minus urgent sells" in each interval, and then finding the typical value for each token. For AAPLx, it was about $190, and for METAx, about $360. This means that a net pressure of $1,900 is 10 times the normal level for AAPLx but only about 5 times for METAx. Thus, when I refer to "10 times the normal level," it is relative to the typical behavior of that token within a one-minute window.
An unexpected finding was that in each transaction, both buyers and sellers agreed on the same price, but the key was who initiated the transaction. An eager buyer takes the seller's higher asking price, while an eager seller accepts the buyer's lower offer. Therefore, in most exchanges, transactions initiated by buyers are usually slightly higher than the preceding seller-initiated transaction. However, on Kraken, it often turns out to be lower because the price moves on its own between two transactions. Kraken's prices also drift continuously when there is no one pushing them. This is the first clue that something outside of Kraken is influencing prices, such as NASDAQ.
Score Results
Below is a comparison between October 28 and another Wednesday, October 14. On both days, NVDAx fell by about 1.8%. On October 14, the scoreboard matched the price, with sellers' active transactions exceeding buyers' by $183,000, leading to a price drop; on October 28, buyers' active transactions were higher, yet the price still fell.
October 28 was not an isolated case. I checked all 45 trading days of the six tokens (a total of 265 token days): among them, in 128 trading days, or about 48%, the CVD and price direction at the close were opposite.
However, weekends are different. When NASDAQ closes, the instances where CVD and price move in the same direction are more frequent. When measured on a scale from 0 to 1 for correlation, weekends score 0.24, while U.S. trading hours score 0.04.
Echo or Amplifier?
This is the core test. In every minute where buyers outnumber sellers (or vice versa), does the price move in that direction?
During U.S. trading hours, with moderate pressure (1–3 times the normal level), the price moves in the direction of the pressure only 51.2% of the time, which is about the same as a coin flip. During overnight periods, with stronger pressure, the price moves in that direction 76% of the time.
-- Price
Buying Pressure Signals Are Only Effective Within That Minute
Buying pressure is like footprints in the sand: it clearly indicates that someone just stepped here, but it doesn’t tell you where they are going next.
The strongest pressure (over 10 times the normal level) in the minute it occurs moves the price in that direction by 5 basis points. After that, the direction of buying pressure disappears. In the next 1 minute, 5 minutes, and 15 minutes, the price only moves 0.6 to 1.3 basis points.
During U.S. trading hours, the duration does not matter. Observing for 1 minute, the price still slightly follows the buying pressure; extending to 1 hour, this connection almost disappears.
If you pick out the most extreme minutes of one-sided buying and selling (the top 2%), and then track the price for 15 minutes:
- During U.S. trading hours: When the price jumps 7.8 basis points in 1 minute, it continues in the same direction to 14.1 basis points. This is because Kraken's flow follows the last real market movement on NASDAQ.
- Overnight / Weekend: When the price jumps 6.8 basis points in 1 minute, it then falls back to 2.4 basis points. Without NASDAQ to follow, a large order can push the thin market; afterward, the price gradually retreats.
Thus, it can be seen that significant peaks during the day are signals worth noting, while significant peaks at night tend to gradually retreat.
The Same Buying Pressure Can Lead to Both Gains and Losses?
Two traders using the same buying and selling pressure can yield completely different results. It’s like pushing two doors with the same force; one door opens, while the other is locked, and it’s not visible from the outside.
I filtered all minutes where "one side's pushing force was roughly the same," resulting in about $1,720 more in buying pressure. In these 100 minutes, the price moved in the direction of the pressure about 64 times and against it about 36 times. Moreover, in a typical 1 minute, the price moved very little, about 0.01%. Therefore, the size of the pushing force itself tells you very little.
Three things can indicate which door is being pushed:
- Is NASDAQ open? During U.S. trading hours, 41% of pushes are against the price direction; overnight, only 27%.
- How busy is that minute? After a quiet hour, 31% of pushes are against the price direction; after a busy hour, it’s 38%, because when it’s busy, price tags change most frequently.
- Is it a single transaction or multiple transactions? A single transaction moves the price median by 0.5 basis points; consecutive transactions of 4 to 10, sweeping through multiple price levels, move the price median by 2.1 basis points.
These are clues about what’s behind the door, not a clear view. To see directly behind the door, you need the order book, and Kraken does not keep historical order book data.
In these cases, buying pressure is worth considering as a signal:
- When the U.S. stock market closes, especially overnight and on weekends, Kraken's own traders have a greater impact on pricing.
- One-sided pressure exceeding 10 times the normal level has the price moving 66% in that direction, while moderate intensity only has 55%.
- Consecutive transactions that sweep through multiple asking prices.
- A sudden large order.
The conclusion is that during U.S. trading hours, Kraken's order flow is an echo of the last market movement on NASDAQ; while overnight and on weekends, it acts as an amplifier, but part of the sound it produces dissipates.
This content is provided for general informational purposes only and doesn't constitute financial, investment, legal, or tax advice. Any events, rewards, online promotions, or related information mentioned herein should not be considered a recommendation, solicitation, or invitation to purchase, sell, trade, or otherwise deal in any crypto assets. Crypto assets are highly volatile and may result in loss. The availability of WEEX services, products, and related events may vary by region. You are responsible for ensuring that your participation is in accordance with applicable local laws and regulations.
You may also like

Shiba Inu Experiences Outflow of 300 Billion SHIB from Exchanges

Hacker moves over 34279.66 ETH from Binance after inactivity
XRP holders demand Ripple burn 31.1 billion tokens by March 2027
Pump.fun Launches Prediction Market Feature in Collaboration with Polymarket

ARTEX AI tool breaches networks in under 3 hours, FBI warns

Gnosis Safe wallet reportedly drained of $6.45M in suspected exploit
Thailand Stablecoin Transfer Limit: What the SEC Draft Proposes

Tesla Autopilot Team Veterans Found Simulation Startup Valued at $1 Billion
TAO Crypto Price Near $190: Is Bittensor (TAO) Recovering or Just Bouncing?
TAO bounced near $190. Compare spot volume, futures positioning, and Bittensor subnet flows to see what would confirm a more durable recovery.
VVV Crypto: What Is Venice Token, Why Venice Token (VVV) Rose and What DIEM Actually Does
Venice Token rose about 14.6% in one November 15 snapshot. Learn what the data shows, how VVV staking works, and what DIEM’s daily API credit buys.
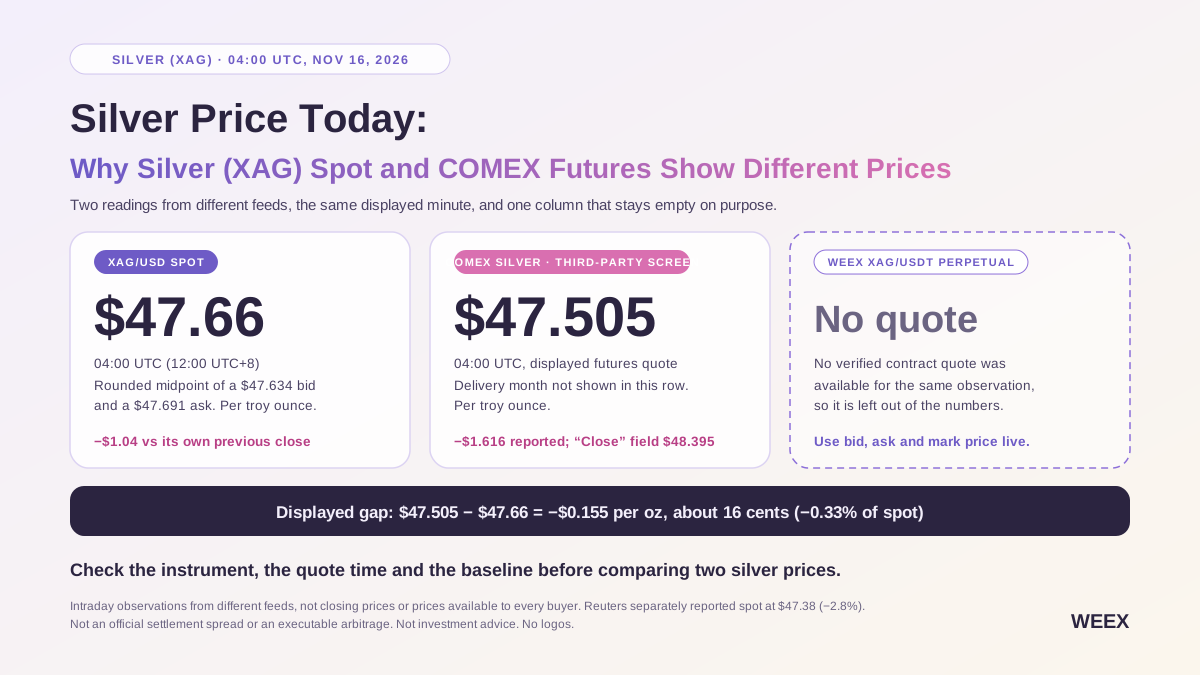
Silver Price Today: Why Silver (XAG) Spot and COMEX Futures Show Different Prices
Silver traded near $47–$48 on November 16. Compare XAG/USD spot, COMEX silver futures, and XAG/USDT perpetuals, and learn why their prices differ.
Options Big Bets | Nvidia's $118 Million Cross-Period CALL Spread Bets on Mid to Long-Term Upside; AMD's Bearish Spread Combined with Long-Term Bullish Spread, Underlying Tensions Between Bulls and Bears

Galaxy Securities: A-shares Market's Downward Risk Converges, Focus on Sector Rotation Opportunities

How $10,000 in stablecoins would have gained €420 without earning interest

Bitcoin now looks cheap by one measure after $1 billion in ETF outflows
These Bitcoin miners have halved their hashrate, while their AI revenues have doubled

Bitcoin: Should We Fear the Worst or Bet on Hopes for a Rebound?

This Under-the-Radar Stock Is Behind Steak 'n Shake's MAHA-Driven Growth. Should You Buy?
XDC vs XRP: Which Payment-Focused Blockchain is Superior?

The Privacy Paradox of Bitcoin: Satoshi Acknowledged It Long Ago, Have the Successors Solved It?

[Analysis] Two Barriers Preventing Bitcoin from Rising

No New Money Inflows in Dogecoin ETFs for a Month
XRP loans trigger 883 liquidations, and $53M remains at risk

CoreWeave and Nebius Group: 1 Soars, the Other 1 Plunges. A Tale of 2 Neoclouds

Research Reveals 3D Spatial Navigation Map of Hand in the Brain to Aid Brain-Machine Interface Development

Yen Fluctuations Highlight Current Trading Difficulties, Investors Have Huge Divergence on Long-term Outlook

BNY Mellon Adds to Invesco Galaxy Bitcoin ETF: What Changes with the Custody Filing?
South Korea Proposes Withdrawal Suspension for Cryptocurrency: What Happens When Exchanges Suspect a Hack

Exclusive: Canton Strategic CEO warns MEV could raise costs for tokenized stock traders

CARF Customer Transaction Information Report: What Data Processing is Required from On-Chain Transactions to Tax Reporting?
Shiba Inu Experiences Outflow of 300 Billion SHIB from Exchanges
Hacker moves over 34279.66 ETH from Binance after inactivity
XRP holders demand Ripple burn 31.1 billion tokens by March 2027
Pump.fun Launches Prediction Market Feature in Collaboration with Polymarket
ARTEX AI tool breaches networks in under 3 hours, FBI warns
Gnosis Safe wallet reportedly drained of $6.45M in suspected exploit
Latest articles


Latest coin listings on WEEX


