
BTC Funding Rate and Open Interest: What Each One Measures and How to Read Them Together

 Prefer us on Google


BTC funding rate and open interest are two of the most quoted numbers in Bitcoin derivatives markets, and they are often mentioned together as if they said the same thing. They do not. The funding rate measures the cost of holding a perpetual futures position, while open interest measures how many contracts are still open.
Reading BTC funding rate and open interest together can show how crowded one side of the market is and whether positions are being added or closed, but neither number predicts price. Because the data differ by platform and by how they are calculated, it helps to know exactly what each figure counts before drawing any conclusion from BTC funding rate and open interest charts.
What Does the BTC Funding Rate Measure?
The BTC funding rate measures the periodic payment exchanged between long and short traders on a perpetual futures contract, and in effect shows which side is paying to hold its position. Perpetual contracts have no expiry date, so platforms use funding to keep the contract price close to the spot price. When the contract trades above the spot index and longs dominate, the rate is usually positive and longs pay shorts. When the contract trades below the index and shorts dominate, the rate is usually negative and shorts pay longs. The platform does not normally keep this payment, because it moves directly between traders.
Funding is quoted as a percentage per interval, and many platforms settle it every eight hours, though some use shorter periods. As an illustration only, a rate of 0.01% on a 10,000 USDT long position costs 1 USDT per payment. At three payments a day, that is 3 USDT a day, or about 10.95% a year if the rate stayed unchanged, by the author’s arithmetic. Rates do change, and many platforms cap them or build them from an interest component and a premium component, so the formula on the contract page is the reference. The funding rate describes the cost of holding a position, not the direction of the market.
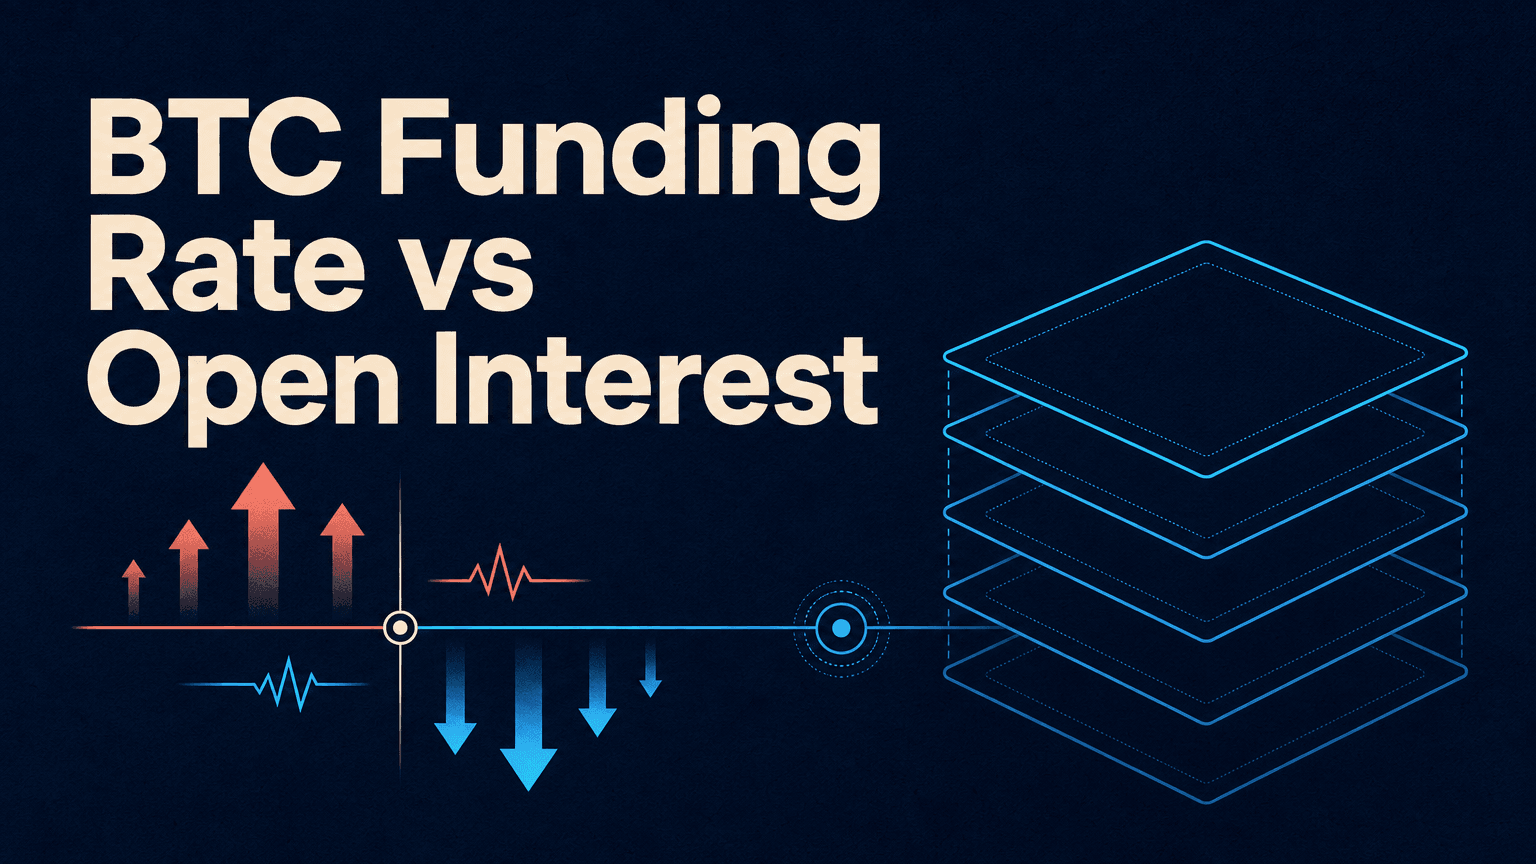
What Does BTC Open Interest Measure?
BTC open interest measures the total number or value of futures contracts that are still open and have not been closed, settled or liquidated. Every contract has a buyer and a seller, so open interest counts each pair once, and long and short open interest are always equal in size. The number changes depending on what traders do. If a new buyer and a new seller open a position together, open interest rises. If an existing holder sells to a new buyer, the position moves from one trader to another and open interest does not change. If both sides close, open interest falls.
Open interest can be quoted in contracts, in BTC or in dollar value, and the choice affects how the chart looks. When it is shown in dollars, a rise in the Bitcoin price lifts the figure even if no new positions have been opened, since the same contracts are simply worth more. For example, if the price rises 10% and the number of contracts stays the same, dollar-denominated open interest also rises about 10%. Open interest therefore shows how much exposure is outstanding, not who is winning, and it says nothing about whether the market is bullish or bearish on its own.
How Do BTC Funding Rate and Open Interest Differ?
The BTC funding rate measures the price of holding a position, while open interest measures the quantity of positions that exist, so one describes cost and the other describes size. The funding rate can change from positive to negative within a day without a single new contract opening, since it reacts to the gap between the contract and the spot price. Open interest can climb steadily while funding stays near zero, which happens when new longs and new shorts open in roughly equal weight and the contract stays near the index.
The two are confused partly because they both come from the same market and both rise during busy periods. A useful way to separate them is to ask what question each answers. Funding asks which side is paying and how much, while open interest asks how many positions are outstanding. Neither shows the direction of the next price move, and neither shows how many traders are involved, since one large account can account for a big share of both figures. They are descriptive indicators of positioning, not forecasts.
-- Price
How Do the Two Metrics Differ, and Why Are They Often Confused?
Traders read the two together by checking whether funding and open interest rise or fall alongside price, which can hint at what kind of positioning is behind a move. The following readings are possibilities, not rules. A rising price with rising open interest and positive funding may reflect new long positions being added, with longs paying to hold them. A rising price with falling open interest may reflect shorts closing their positions, sometimes called a short squeeze. A falling price with rising open interest may reflect new short positions, or longs adding to losing trades. A falling price with falling open interest may reflect liquidations and positions being closed.
Funding adds a second layer. A high positive rate together with high open interest can mean that many traders are long and paying a premium, so a sharp price fall could trigger a chain of forced liquidations. A negative rate with rising open interest may show that shorts are crowded, so a sudden rise could force them to close. These patterns can persist for long periods without a reversal, and they have also appeared before moves in the opposite direction. The sensible use of the numbers is as context for risk, such as how much leverage is in the market, and not as a signal to open or close a trade.
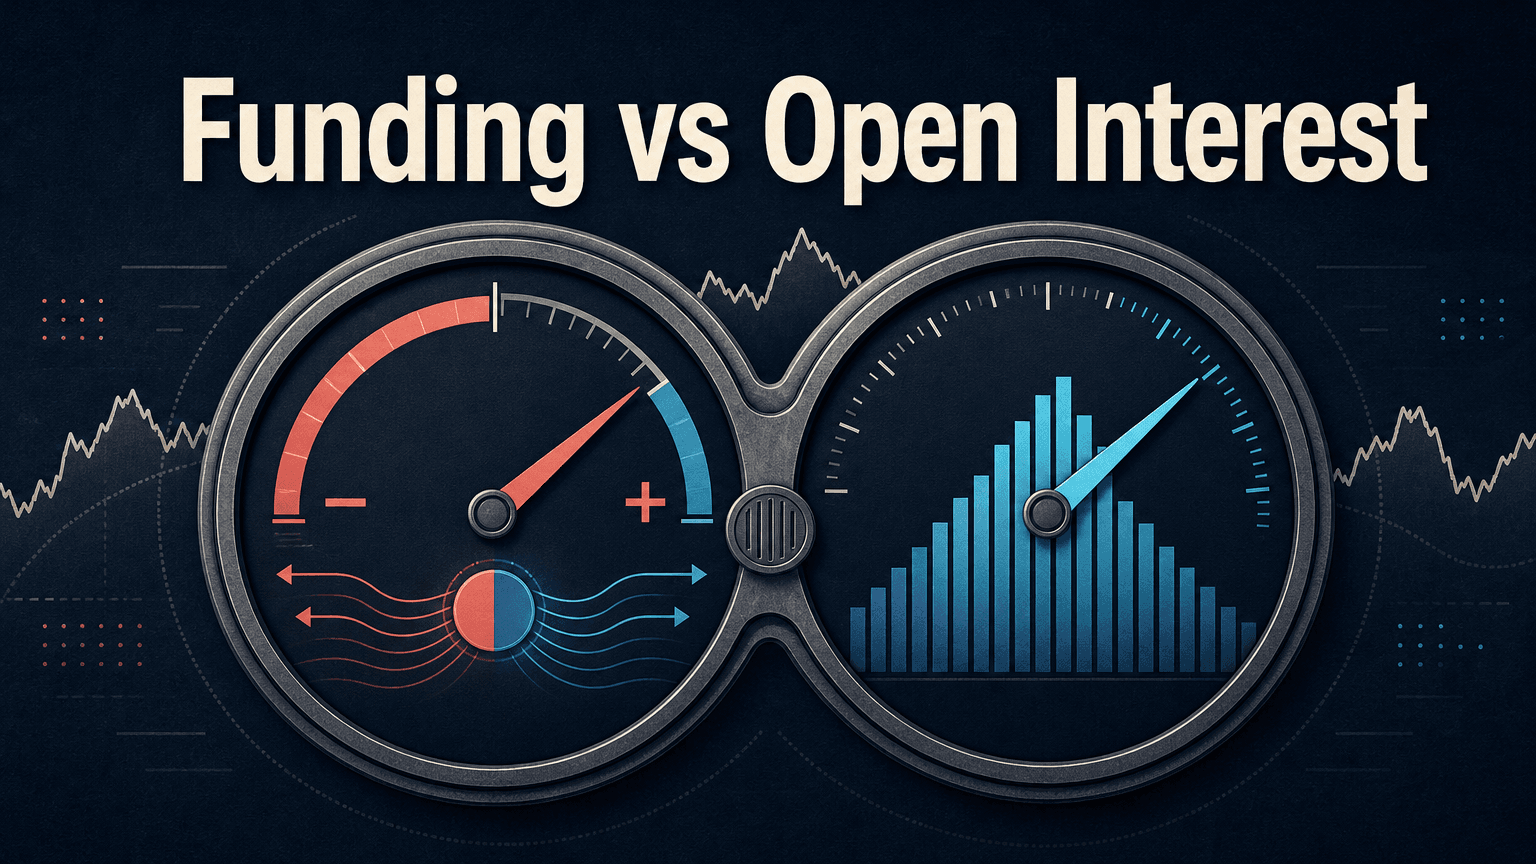
What Are the Limits of These Metrics, and What Do They Not Tell You?
The main limits are that the figures differ by source, that they miss hedged positions and that they cannot show direction. Each exchange reports its own funding rate and open interest, and aggregator websites combine them in different ways, so two charts can show different values on the same day. Contracts can be margined in USDT or in coins, funding intervals differ, and some sources count only certain exchanges. Comparing a number from one source with a number from another can therefore give a false impression.
Hedged trades are another source of confusion. Some traders hold spot Bitcoin and a short perpetual position at the same time to collect positive funding while staying neutral on price. Their positions add to open interest and to funding payments without expressing a view on direction, so high open interest with positive funding does not always mean that traders are betting on a rise. Options, which sit outside these figures, are a separate part of the derivatives market. Finally, both measures react to events and often move after the price does, which limits their value as early warnings. Anyone using them should compare several sources, note the time of each reading and treat the numbers as one input among many.
Conclusion
BTC funding rate and open interest measure different things: funding shows the cost of holding a perpetual position and which side pays, while open interest shows how many contracts remain open. Read together, they can show how crowded the market is and whether positions are being added or closed.
Neither figure predicts price, and both depend on the source, the denomination and the time of the reading. Readers who follow these metrics can compare more than one data provider and use them as context for risk, not as a trading signal.
FAQ
1. What does the BTC funding rate measure?
The BTC funding rate measures the periodic payment between long and short traders on a perpetual contract. A positive rate usually means longs pay shorts.
2. What does BTC open interest measure?
BTC open interest measures the total number or value of futures contracts that remain open. It rises when new positions are opened and falls when positions are closed.
3. Do BTC funding rate and open interest predict price?
No, BTC funding rate and open interest describe positioning and costs and do not forecast price. They can add context about crowding and leverage.
4. How do BTC funding rate and open interest differ?
The funding rate shows the cost of holding a position, while open interest shows how many positions exist. BTC funding rate and open interest can move independently.
5. Why do BTC funding rate and open interest differ between websites?
Exchanges report their own figures, and aggregators combine them differently, using different contracts, margin types and intervals. Comparing the source and the time of each reading helps avoid mistakes.
This content is provided for general informational purposes only and doesn't constitute financial, investment, legal, or tax advice. Any events, rewards, online promotions, or related information mentioned herein should not be considered a recommendation, solicitation, or invitation to purchase, sell, trade, or otherwise deal in any crypto assets. Crypto assets are highly volatile and may result in loss. The availability of WEEX services, products, and related events may vary by region. You are responsible for ensuring that your participation is in accordance with applicable local laws and regulations.
You may also like
How Transparent Is a Crypto Exchange? Checking Proof of Reserves and Protection Funds
How to Use the WEEX Trust Center: Check Reserves, Protection Fund and Official Contacts
Crypto Leverage Trading Explained: How Perpetual Futures, Margin and Liquidation Work
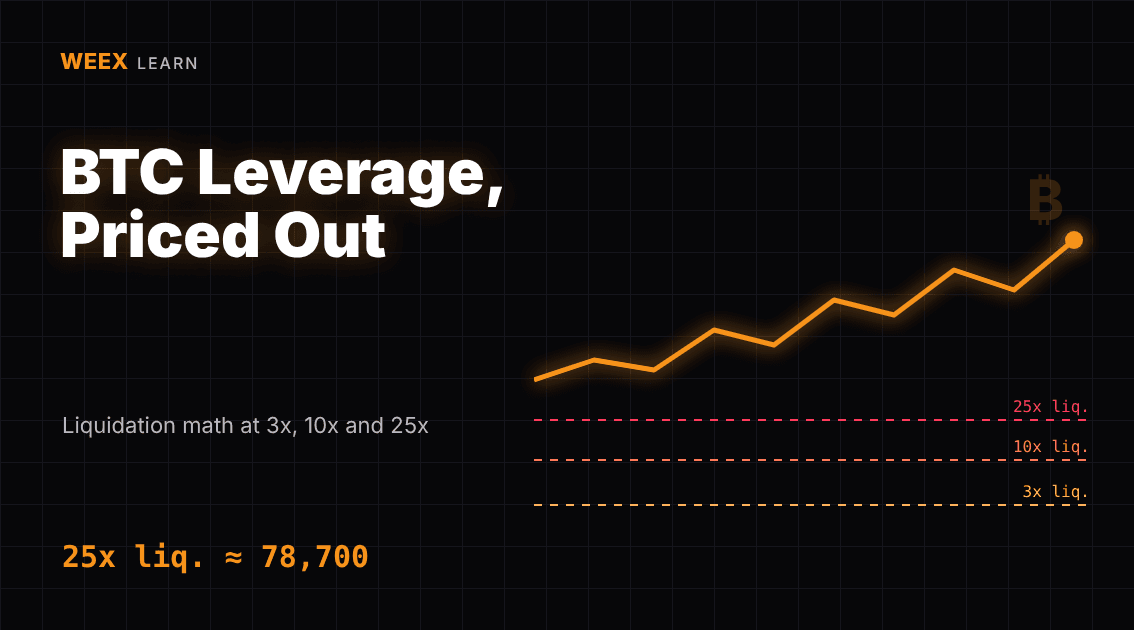
Bitcoin Margin Trading: BTC Liquidation Math at 3x, 10x and 25x
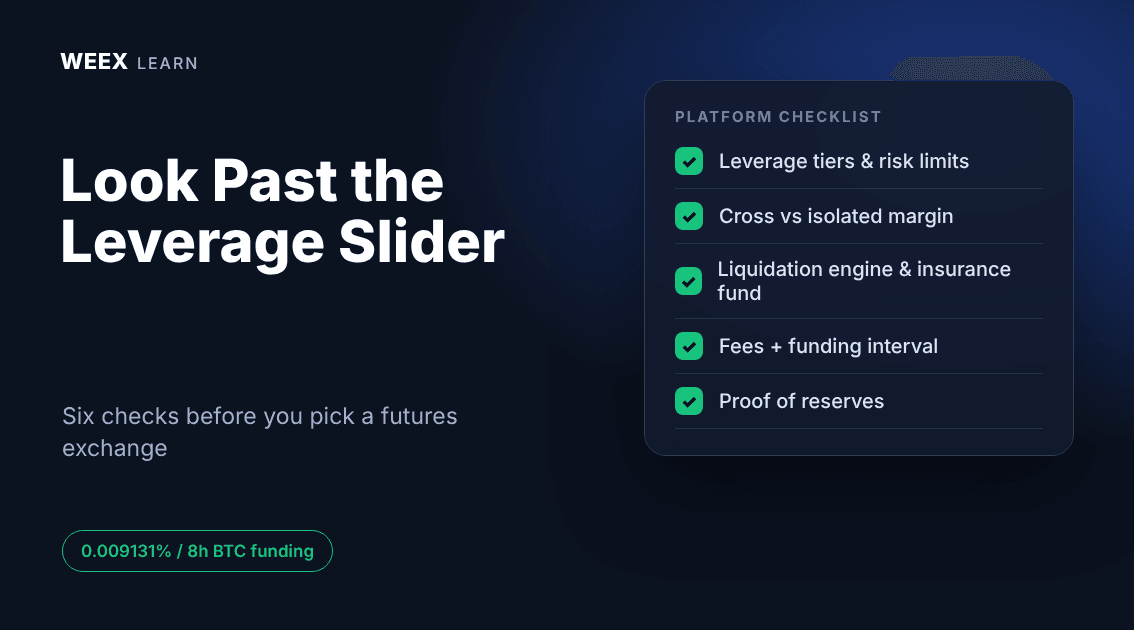
Crypto Leverage Trading Platform: 6 Checks Before You Deposit
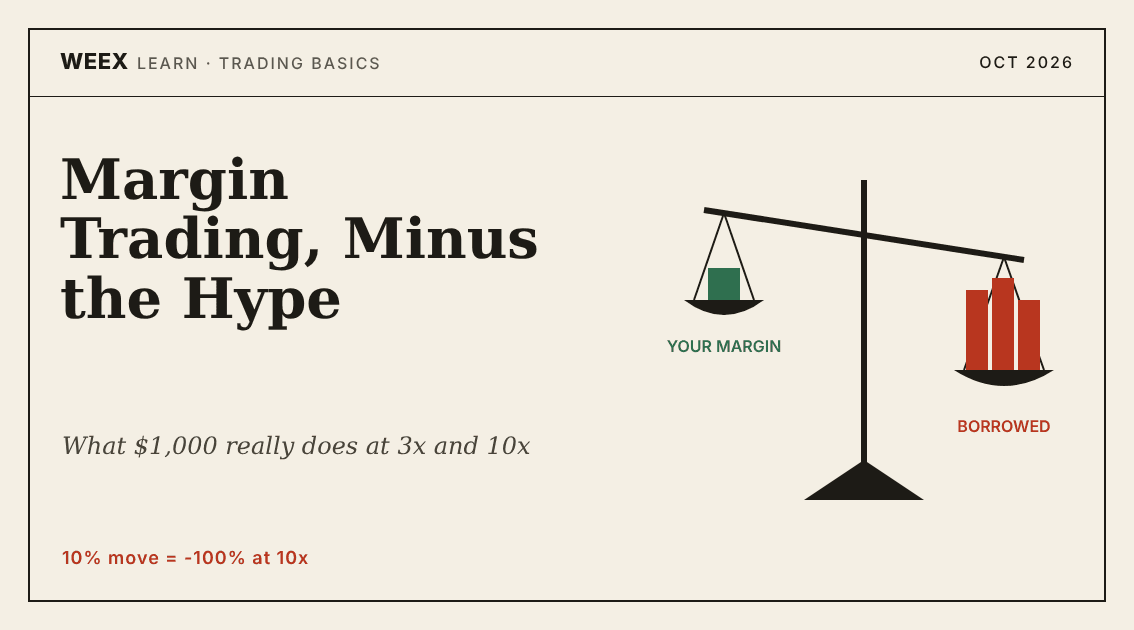
What Is Margin Trading? A $1,000 Example at 3x and 10x Leverage
How to Day Trade Crypto for Beginners: The Math Behind One Trade
Trading Psychology for Beginners: Crypto Traps and Hard Rules
What Is a Bitcoin ETF? How Creation, Custody and Fees Work

What Is Blockchain and How Does It Work? One Transaction, Traced
WEEX Convert Fees: What Zero-Fee Conversion Really Costs You

WEEX Convert Quote: How the 8-Second Price Lock Really Works
WEEX Convert Limits: Minimum and Maximum Amounts Explained
How to Check a WEEX Convert Order: History, Rate and Status

USDC Significant EMT Status in the EU: What Changes on November 12 Under MiCA
Walrus (WAL) Jumps 30%: Sui Storage Token Rallies on AI Data
Bitcoin Price After Hot CPI: Why BTC Is Pinned Near $82,000
What Is a Limit Order? How It Works and When to Use It

Best Crypto Miner for Beginners: What to Check on Cost, Power, Hashprice and Profit Before You Buy

Limit Order vs Market Order: Which One to Use When Trading Crypto
What Is a Limit Order? How It Works in Crypto With BTC Examples
Stop Limit Order: How It Works and Why It Can Fail to Fill
Best Crypto Platform for Beginners: Pick by Goal, Not Brand

Best Crypto Podcasts for Beginners: A 4-Week Listening Plan
How to Buy Crypto Anonymously: 5 Methods, Real Costs and Limits

Will Bitcoin Break $87,000 This Week? CPI, Fed Speakers and ETF Outflows to Watch

Conflux (CFX) Price Jumps on China's National Blockchain Network Plan: Does the Policy Actually Name CFX?
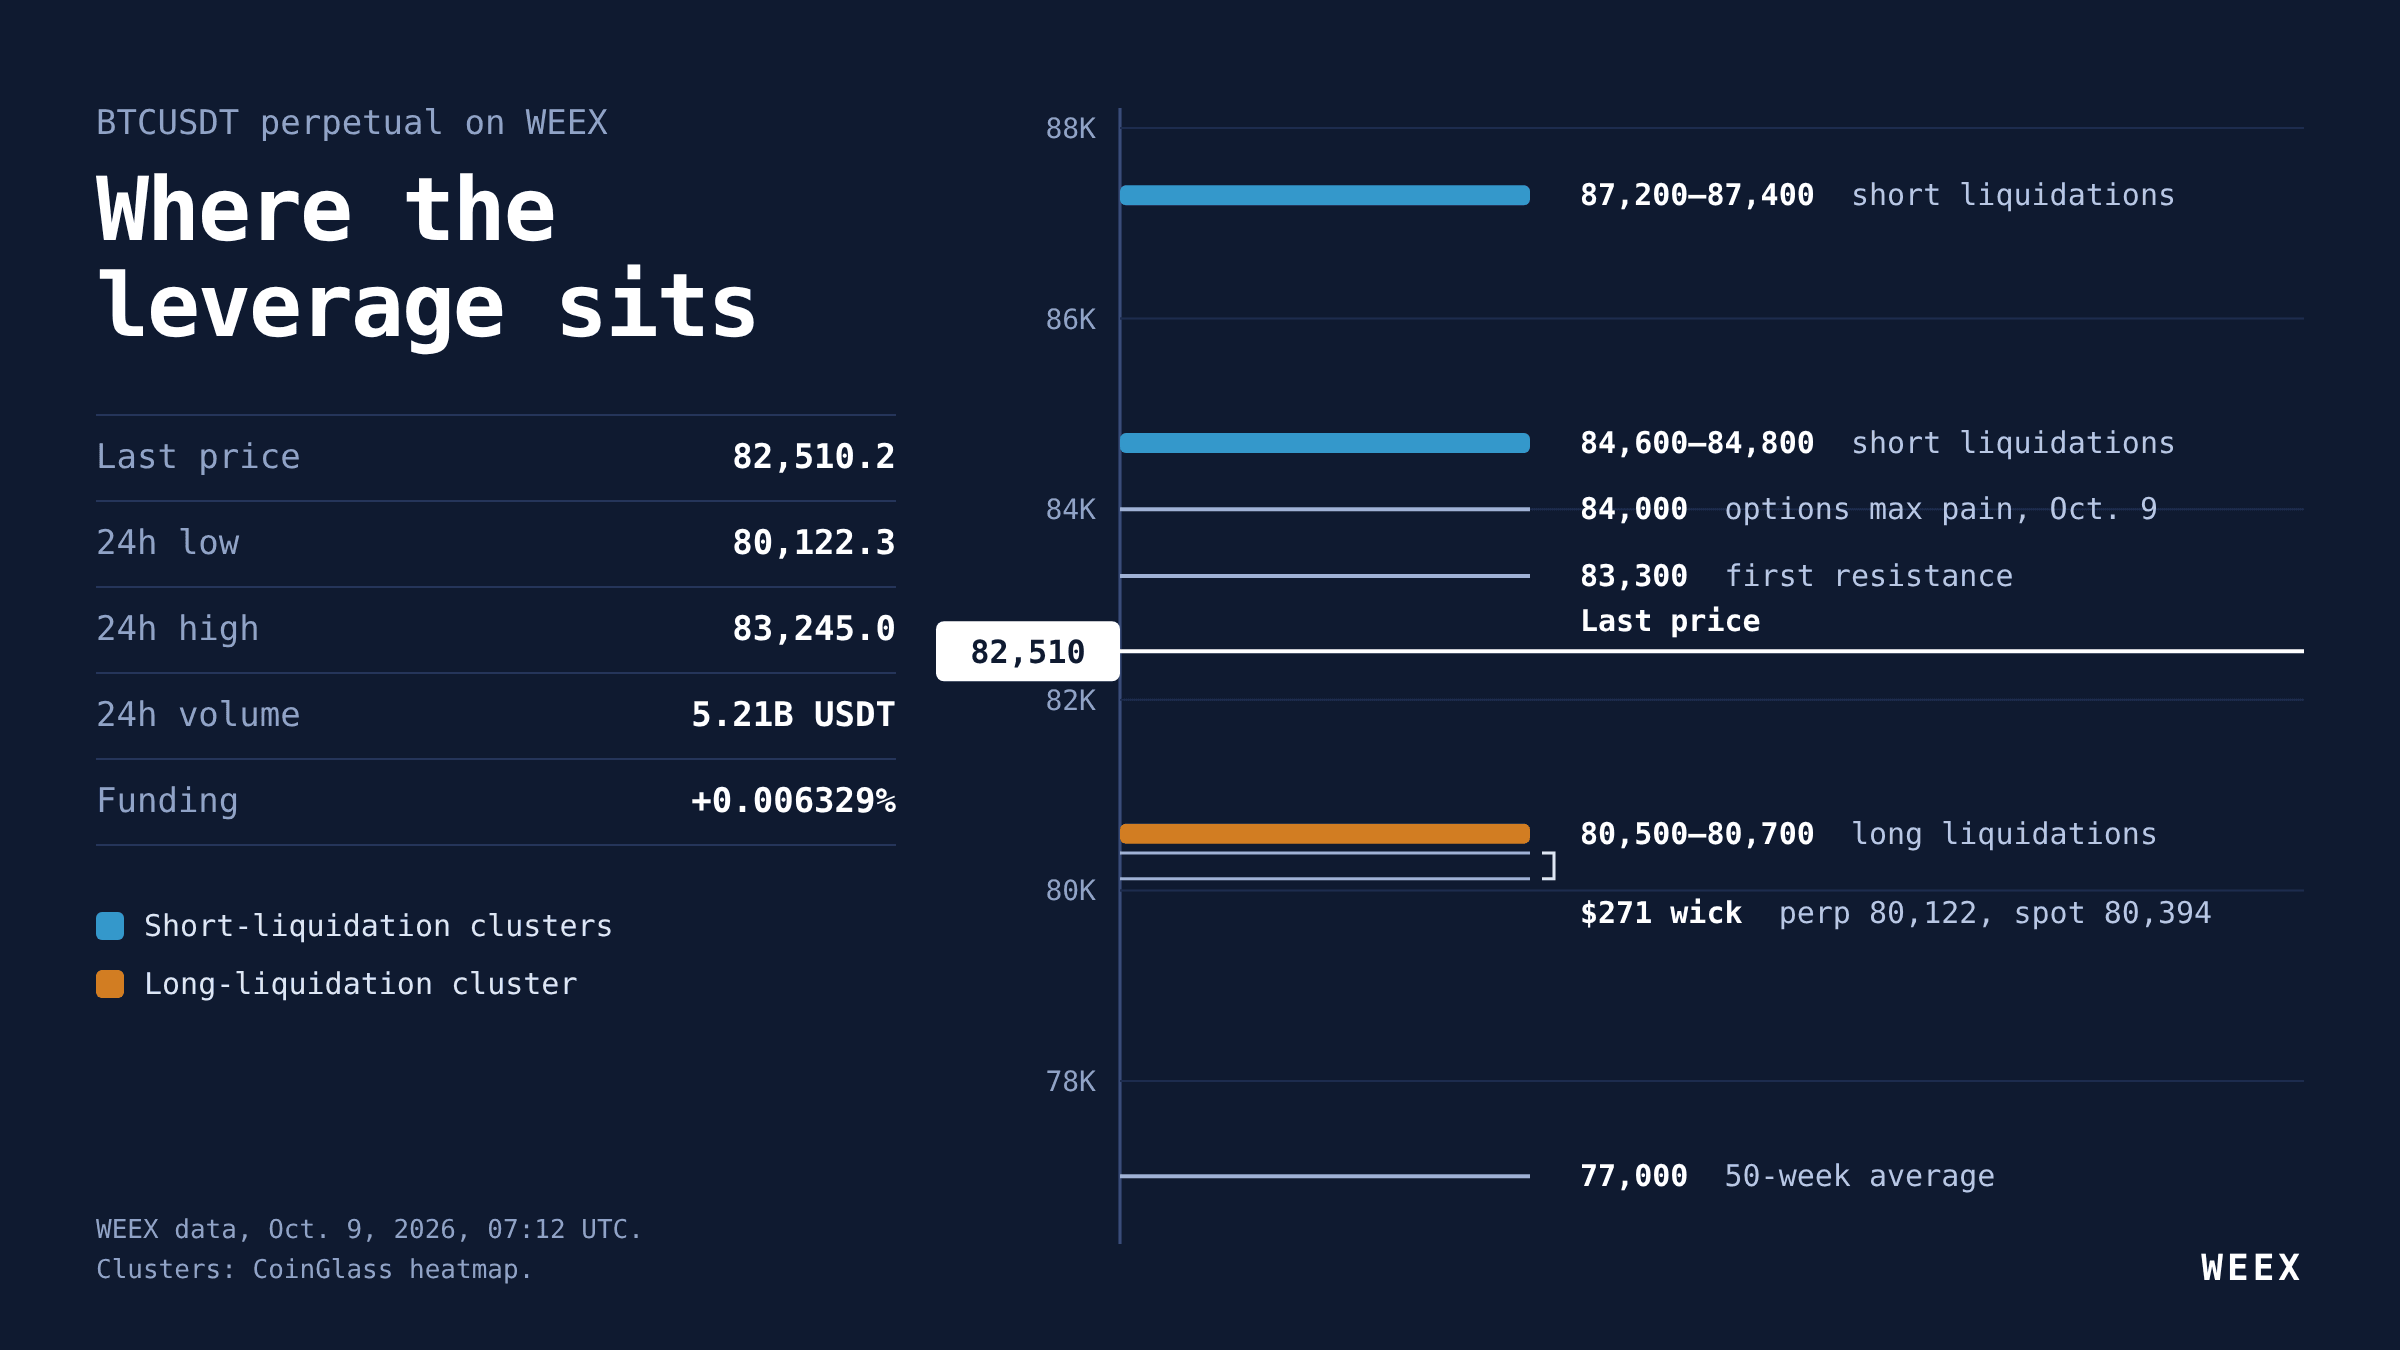
BTC Futures Analysis: $80K Held, but Longs Are Still Paying Up
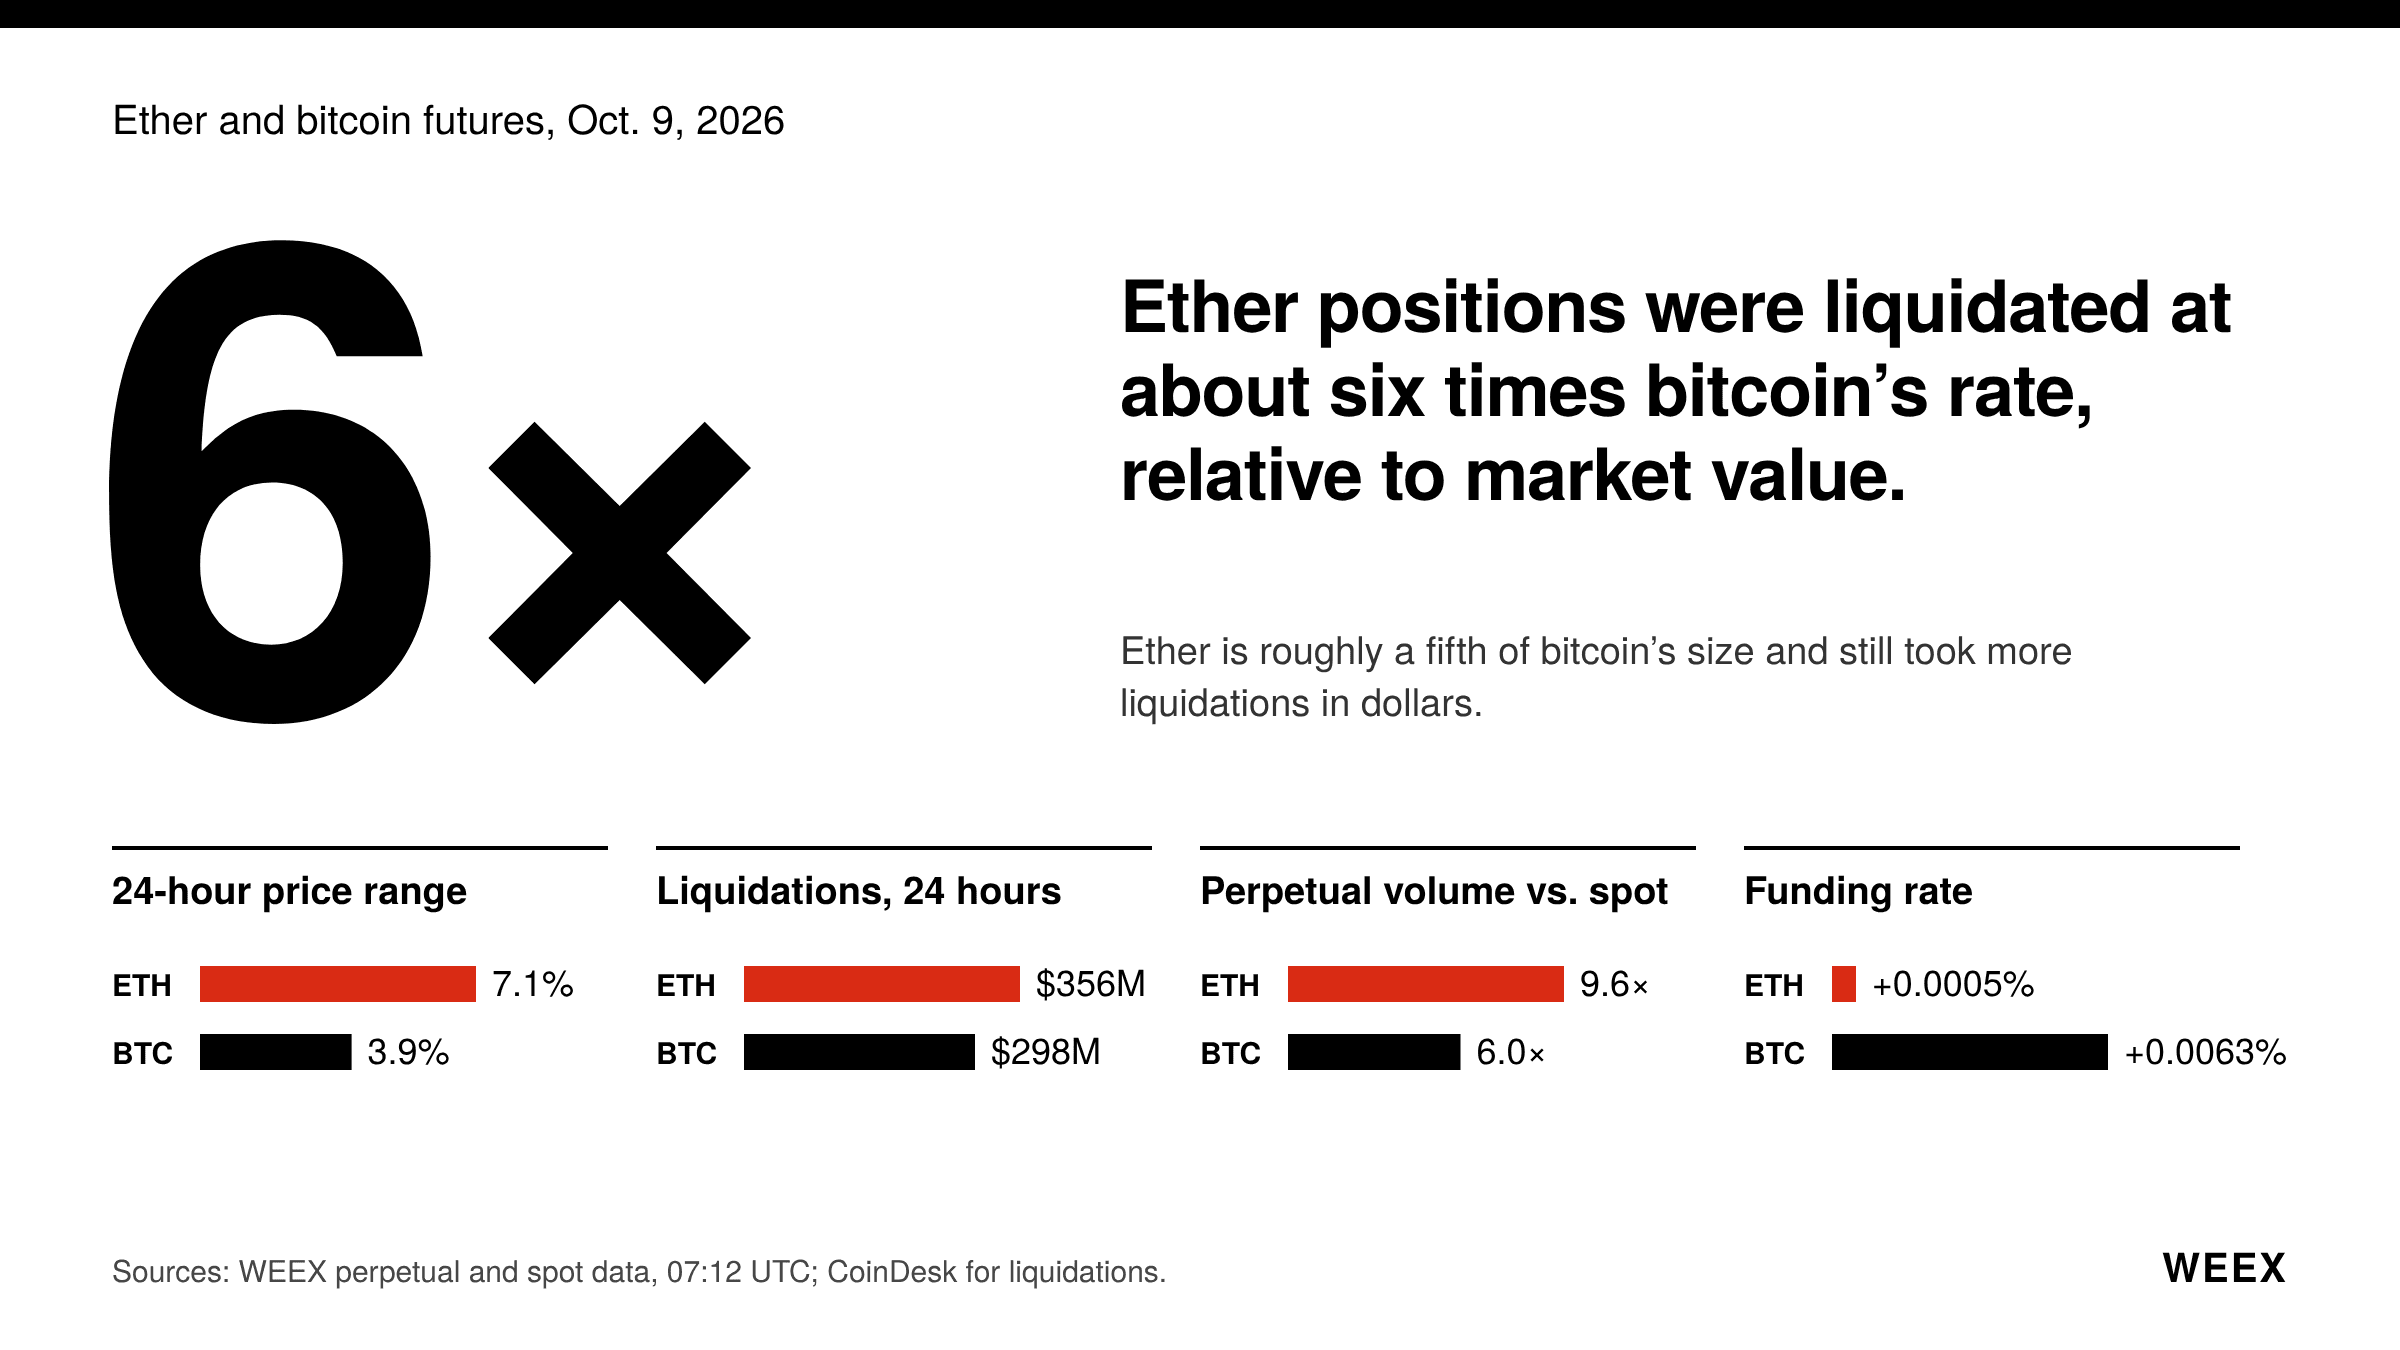
ETH Futures: Why Ether Is Falling Faster Than Bitcoin This Week
ENA Token Price Drops After October 5 Unlock: What Happened to Ethena?
How Transparent Is a Crypto Exchange? Checking Proof of Reserves and Protection Funds
How to Use the WEEX Trust Center: Check Reserves, Protection Fund and Official Contacts
Crypto Leverage Trading Explained: How Perpetual Futures, Margin and Liquidation Work
Bitcoin Margin Trading: BTC Liquidation Math at 3x, 10x and 25x
Crypto Leverage Trading Platform: 6 Checks Before You Deposit
What Is Margin Trading? A $1,000 Example at 3x and 10x Leverage


